


On this page
The reflector vs TIR lens question is the reason two 20-inch LED light bars that both claim 1000 lm and the same LED bin can put two completely different shapes on the same wall. The LED sets the total light output and the color; the secondary optic in front of it sets the direction, the beam edges, and the peak intensity. Nothing about the diode changes when you swap the optic. Everything about the beam does.
Quick answer
In a reflector vs TIR lens comparison, both parts are secondary optics. Both take the light that has already left the LED package and re-aim it. The reflector cup re-aims light by bouncing it off a polished or coated surface. A TIR lens re-aims light by refracting it at the entry surface and then reflecting it inside a dense optical material before letting it exit through a shaped front face. Because the two mechanisms control different parts of the emitted cone, they produce different beam edges, different amounts of spill light, and different peak intensities from an identical LED.
Three things follow from that, and they are the spine of this article:
- Neither mechanism creates light. Both redistribute the luminous flux that the LED already emitted, which is why a bar cannot gain lumens by changing its optic.
- Luminous flux alone, expressed in lumen, has no direction attached to it. A number like “1000 lm” describes a total, not a direction, so it cannot answer “how far will this throw?”
- Peak intensity in candela and beam angle are two views of the same redistribution. A narrow beam concentrates the same flux into a smaller solid angle, so the peak candela must rise. That is geometry, not marketing.
One boundary up front: this article does not claim that either mechanism is more efficient than the other. Published comparison data for that specific claim was not available when we wrote this, so we do not make the claim. What follows is what the definitions support.
Why two light bars with the same LED and the same lumens look nothing alike on a wall
Picture two 20-inch single-row bars mounted side by side on the same bracket, aimed at the same garage door from the same 5 m distance. Both product pages print the same LED count, the same color temperature, and the same 1000 lm total. On the door, one produces a wide pool of light with a soft edge that fades gradually into shadow. The other produces a tighter, brighter patch with a hard boundary and a long, dim halo around it.
The instinct is to blame the LED, the driver, or the wattage. Almost always the difference is the optic. The wall is showing you the luminous intensity distribution of each bar, which is the physical quantity that actually decides what you see. Two bars can share a flux total and still have completely different intensity distributions, because the distribution describes where the flux went, not how much of it there is.
This is not a subtle technicality. It is the difference between a specification that answers “how much total light does this produce?” and a specification that answers “how bright is it in the direction I am pointing it?” Those are two different measurements, in two different units, taken with two different instruments. A page that gives you only the first cannot answer the second, no matter how large the first number is.
The relevant background reading on the marketing side of that gap is our article on raw lumens vs effective lumens, which deals with which number on a product page is credible. This article takes the next step back and deals with why those numbers are related the way they are.

Pin down the photometric units first: flux, intensity, illuminance, luminance, efficacy
Before anything about reflectors or lenses makes sense, five quantities and their units need to be fixed. The CIE e-ILV defines four of them directly, and every one of them is a derivative of an energy quantity with respect to a different variable. Getting the variable right is the whole game.
| Quantity | Symbol and unit | What the definition differentiates, and with respect to what | Direction attached? |
|---|---|---|---|
| Luminous flux | Φv, lumen (lm) | Light energy with respect to time, weighted by the CIE standard photometric observer | No |
| Luminous intensity | Iv, candela (cd = lm per steradian) | Luminous flux with respect to solid angle, in a specified direction, with the source treated as a point | Yes |
| Illuminance | Ev, lux (lx = lm per m²) | Incident luminous flux with respect to area, at a point on a real or imaginary surface | Yes, as a position on a surface |
| Luminance | L, candela per m² (cd/m²) | The eye’s impression of brightness of a luminous or illuminated surface | Yes, and it is what the eye actually sees |
| Luminous efficacy | η, lumen per watt (lm/W) | Electrical power converted into light | No |
Three of those definitions are worth reading carefully, because the details are exactly where field arguments go wrong.
Luminous flux is the light energy differentiated with respect to time, evaluated with the CIE standard photometric observer. Its unit is the lumen. The definition contains no direction, no solid angle, and no distance. That is not an omission; it is the point of the quantity.
Luminous intensity is the luminous flux differentiated with respect to solid angle, taken in a specified direction, with the source approximated as a point source. Its unit is the candela, equal to one lumen per steradian. From the intensity distribution Iv(θ, φ) you can integrate back to the flux inside any solid angle. This is the quantity a light bar’s beam pattern is made of.
Illuminance is the incident luminous flux differentiated with respect to area, at a point on a real or imaginary surface. Its unit is the lux, equal to one lumen per square meter. This is the quantity a light meter reads when you hold it against a wall, a road, or a workbench.
The German automotive lighting reference HELLA Tech World states the same set in workshop language: flux is the entire light output radiated by a source; intensity is the part of the flux travelling in a specific direction; illuminance is incident flux divided by the illuminated area, with 1 lm falling uniformly on 1 m² giving 1 lx; luminance is the eye’s impression of brightness of a luminous or illuminated surface; and luminous efficacy is how efficiently consumed electrical power is converted into light. HELLA publishes these as a units table compiled for repair shops, so treat it as an explanatory source rather than a measurement standard. The formal definitions live in the CIE vocabulary.
The consequence for a buyer is direct. A specification sheet that lists only lumens has told you the value of a quantity with no direction. To learn anything about reach, you need the intensity distribution, or at minimum a peak intensity in candela paired with a stated beam angle. Both numbers, together, describe one distribution.
There is one more unit that shows up in automotive work and causes confusion. Color temperature, in kelvin, describes the chromaticity of the light, not its brightness. HELLA notes that a higher color temperature means a larger blue share and a smaller red share, gives warm white as roughly 2700 K, and places a D2S gas discharge lamp near 4250 K against daylight at about 5600 K. Color temperature and candela are unrelated quantities. A 6000 K bar and a 3000 K bar with identical optics can put identical intensity on a wall; only the color impression differs. We covered color temperature on its own terms in a separate article, and this one does not revisit it.
What the candela is, and why the CIE points at IEC for its definition
The candela is the only one of these units that is an SI base unit, which makes it the anchor for everything else. The CIE e-ILV entry for the candela is deliberately short: it does not restate the definition. It points to IEC IEV 112-02-10, meaning the foundational definition of the candela lives in the IEC and BIPM system, and CIE documents its usage in lighting terminology rather than redefining it.
That division of labor matters when you read a specification sheet. A test lab reporting candela is claiming traceability to the SI base unit, and the traceability chain runs through national metrology institutes. The CIE vocabulary, by contrast, is the authority for what the word means when a lighting engineer uses it. Both are needed: the definition comes from one system, the accepted usage from the other.
For an LED light bar, the practical reading is that candela is not a marketing unit. It is a base unit of the International System, with a defined realization chain and stated uncertainty. When a manufacturer prints a peak intensity in candela without a test report, they are using a base unit on the strength of an unstated measurement. That is the part worth scrutinizing, and we come back to it in the checklist section.
Optical beam axis: why the axis of the beam is not the axis of the lamp
The CIE vocabulary defines the optical beam axis as the axis about which the luminous intensity distribution is substantially symmetric. The definition then states two negatives that are easy to skim past: the optical beam axis is not necessarily the same as the lamp axis passing through the cap, and it is not necessarily the same as the lamp axis perpendicular to the reference plane.
Read those two negatives as a warning about a specific failure mode. A lamp has a mechanical axis defined by its housing, its bracket, or its mounting flange. It has an optical beam axis defined by where the intensity distribution is symmetric. Nothing in the definitions forces the two to coincide, and the CIE entry explicitly declines to assume that they do. The entry also presents the relationships among the optical beam axis, the mechanical or geometric axis, peak intensity, and center beam intensity in a diagram, which is a signal that these are treated as distinct concepts.
Three practical consequences follow.
Aim by the beam, not by the housing. If you level a bar using its bracket and assume the light goes where the bracket points, you have aligned a mechanical axis and said nothing about the optical one. This is why a bar can look perfectly square in its mount and still throw its hot spot off to one side.
Peak intensity has its own direction. Peak intensity is the maximum of the intensity distribution, and it lies on the optical beam axis. Center beam intensity refers to the direction of the reference axis, which may not be the peak. A specification that reports one number as “beam intensity” without saying which of the two it is has left the ambiguity open.
Symmetry is part of the definition. The optical beam axis is defined by symmetry of the distribution. An asymmetric beam, such as an automotive low beam with its cut-off line and its asymmetric rise on the kerb side, does not have a simple symmetric axis in the same sense. That is not a defect in the term; it means the term has to be applied thoughtfully to asymmetric distributions.
Partial luminous flux and useful luminous flux: the light inside the cone is the light that does the work
Here is the term that resolves most of the confusion in this subject, and it comes straight out of the CIE vocabulary.
Partial luminous flux, Φv,p,α, is the luminous flux emitted within a specified cone angle α, determined by the luminous intensity distribution Iv(θ, φ) of the source. The direction (θ, φ) = (0, 0) is the cone axis. That axis may coincide with the mechanical axis, may coincide with the optical beam axis, or may be some other direction entirely, and the CIE entry requires that it be stated. The angle α is the full cone angle, given in degrees or radians and likewise stated, as in the notation Φp,90°. The entry also records the synonym “cone luminous flux”.
Useful luminous flux, Φv,u,α, is the part of a source’s luminous flux that contributes substantially to the lighting task at hand. For a directional source, useful luminous flux is the partial luminous flux within a specified cone whose axis is the optical beam axis of the source. For a non-directional source, the useful luminous flux equals the source’s total luminous flux.
Combine the two entries and you get a statement that can be written down as a fact rather than an opinion: a bare lumen figure carries no cone convention, and it only acquires physical meaning for a directional product when it is written as a partial or useful luminous flux with the cone angle α attached. That is precisely why the same LED, moved between two different secondary optics, delivers a different useful luminous flux even though the total luminous flux is unchanged.
Put concrete numbers on it and the point sharpens. Suppose a bar emits 1000 lm in total. If the secondary optic squeezes 70 % of that total into a 30° cone and the rest escapes into wide-angle spill, then the useful luminous flux inside that cone is 700 lm, and the other 300 lm is still leaving the fixture, still consuming the same electrical power, and still able to bother a driver coming the other way. A second optic might put 85 % into the same 30° cone, giving 850 lm of useful flux. The fixture’s total is 1000 lm in both cases. The specification sheet that prints only “1000 lm” is identical for both, and the products are not.

The CIE vocabulary does not assign a numeric threshold for “substantially” in the useful luminous flux definition, and neither do we. The definition is a framework: pick a cone, name its axis, and report the flux inside it. Two labs that pick different cones will report different useful flux for the same lamp, and both can be correct. That is why the cone convention has to travel with the number.
This is also the point where the term “effective lumens” gets used loosely in product marketing. Cone-defined flux is a formally defined quantity in the CIE vocabulary; “effective lumens” is not. Our companion article on raw lumens vs effective lumens covers what that marketing term does and does not pin down. Here, the formal version is what matters: partial or useful luminous flux, with a named cone axis and a stated full cone angle.
Deriving the solid angle of a cone: where Ω = 2π(1 − cos(α/2)) comes from
Every candela figure for a directional product is a statement about flux per unit solid angle, so the solid angle of a cone has to be computable from the cone angle alone. It is, and the derivation is short enough to do on paper, which is the point: this is not an industry formula to be taken on trust, it is spherical geometry.
A solid angle is measured in steradians, and one steradian is the solid angle that, with its vertex at the center of a sphere of radius r, cuts out an area of r² on the sphere’s surface. The whole sphere therefore subtends 4π sr, because the sphere’s surface area is 4πr².
Now take a right circular cone with its vertex at the center of that sphere, and let α be its full cone angle, the angle between one edge of the cone and the opposite edge. The half angle is α/2. The cone cuts a circular cap off the sphere. In spherical coordinates with the cone axis as the pole, an element of solid angle is sin θ dθ dφ, where θ runs from 0 at the pole to α/2 at the edge of the cap and φ runs from 0 to 2π around the axis.
Integrate φ first, which contributes a factor of 2π:
- Ω = 2π multiplied by the integral from 0 to α/2 of sin θ dθ
The antiderivative of sin θ is −cos θ, so the definite integral evaluates to (−cos(α/2)) − (−cos 0), which is 1 − cos(α/2). That gives
- Ω = 2π (1 − cos(α/2)) steradians
Two sanity checks confirm the result. As α approaches 0, cos(α/2) approaches 1 and Ω approaches 0, so a vanishing cone encloses no solid angle. As α approaches 180°, cos(α/2) approaches 0 and Ω approaches 2π, which is the solid angle of a half space. If you extend α past 180° the cone stops being physically meaningful for an emitter, which is why the relation is quoted for α up to 180°.
The relation converts a beam angle into a solid angle with no reference to the lamp, the LED, or the optic. It is a property of the cone, nothing else. That is why the same arithmetic works for a 30° spot, a 60° combo cone, and a 120° flood.
| Full cone angle α | Half angle α/2 | Cosine of half angle | Solid angle Ω = 2π(1 − cos(α/2)) |
|---|---|---|---|
| 30° | 15° | 0.96593 | approximately 0.2141 sr |
| 60° | 30° | 0.86603 | approximately 0.8418 sr |
| 90° | 45° | 0.70711 | approximately 1.8403 sr |
| 120° | 60° | 0.50000 | exactly π, approximately 3.1416 sr |
Every solid angle in that table is computed from the relation above, and nothing else. They are geometry, not measurements.

Peak intensity, beam angle and total flux: why a narrow beam must produce more candela
With the solid angle relation in hand, the geometric necessity behind the whole subject becomes visible in one line.
The CIE definition of luminous intensity says that intensity is the luminous flux differentiated with respect to solid angle, taken in a specified direction, with the source approximated as a point source. Turn that derivative into an average over a cone and you get the working form used throughout this article:
- I = Φ divided by Ω
Here Φ is the luminous flux inside the cone in lumen, Ω is the solid angle of that cone in steradians from the previous section, and I is the average luminous intensity in candela over that cone. The relation is a direct consequence of the definition of the two quantities, not a separate formula borrowed from somewhere.
Now hold Φ fixed and let Ω change. Suppose a bar emits 1000 lm inside a 60° cone. From the table, Ω for 60° is approximately 0.8418 sr, so the average intensity across that cone is about 1188 cd. Narrow the same 1000 lm into a 30° cone and Ω drops to about 0.2141 sr, so the average intensity across that cone rises to about 4671 cd. Nothing about the LED changed. The flux total is identical. Only the cone changed, and the candela figure moved by a factor of roughly four.
Read the relation backwards and the same fact appears as a constraint. If a fixture’s optic spreads its flux over a wider solid angle, the average intensity inside that solid angle must fall. There is no configuration in which the same flux spread more widely is brighter in a given direction. A wider beam from equal flux is a dimmer beam peak by construction. That is what “narrow equals more candela” means, and it is arithmetic rather than a property of reflectors, lenses, or brands.
The working form above is an average over the cone, and real distributions are not uniform. A real bar has a hot spot near the optical beam axis where intensity exceeds the cone average and a falloff toward the edge where it is below. So the number computed from I = Φ/Ω is a lower estimate of the peak intensity for a beam of that shape, not a prediction of it. Treat it as a floor and a consistency check on a datasheet, not as a substitute for a measurement.
That gives a practical test that costs nothing. Take a product page that lists a total flux and a beam angle but no peak intensity. Compute 1000 divided by the solid angle of the stated cone for the round numbers it advertises, and you have the minimum average intensity that any fixture with that flux and that cone must exceed somewhere in the beam. If a measured peak candela figure later comes in below that floor, either the flux claim, the beam angle claim, or the measurement is wrong. If it comes in dramatically above the floor, that is normal for a spot optic with a strong hot spot, and it tells you the distribution is peaked rather than flat.
| Same 1000 lm total, different cone | Solid angle Ω | Average intensity Φ/Ω | Peak intensity |
|---|---|---|---|
| 30° cone | about 0.2141 sr | about 4671 cd | higher than the average, by an amount the datasheet must state |
| 60° cone | about 0.8418 sr | about 1188 cd | higher than the average, by an amount the datasheet must state |
| 120° cone | about 3.1416 sr | about 318 cd | higher than the average, by an amount the datasheet must state |
The pattern in that table is the single most useful thing to carry away from this article. The flux is constant at 1000 lm and the average intensity varies by more than a factor of fourteen across the three cones. Any claim that a wider beam and a narrower beam have “the same brightness” is arithmetically impossible if the total flux is the same and the beam angles differ.
One caution about the approximation. Treating the source as a point at the cone vertex is the CIE convention for luminous intensity, but a lamp has physical extent and its near-field distribution is not the far-field pattern. Close to the fixture, the point-source approximation breaks down and the inverse-square relation in the next section stops being accurate. For a light bar measured at two or three meters, the approximation is reasonable. At 30 cm it is not, and no arithmetic fixes it.

Illuminance and the inverse square law: E = I / d², and how NIST uses the same relation backwards
Intensity describes the beam. Illuminance describes the surface the beam lands on, and it is the quantity a handheld meter reads. The two are linked by the geometry of a sphere, and the link is the same relation that a national metrology institute uses to realize the candela itself.
Start from the definitions. Luminous intensity is flux per unit solid angle in a given direction. Illuminance is flux per unit area at a point on a surface. Put a surface at distance d from a point source, oriented perpendicular to the direction of the beam. The flux within a small solid angle Ω of the beam illuminates an area A on that surface. By the geometry of a sphere, that area is A = Ω multiplied by d². So the illuminance is:
- E = Φ / A = (I × Ω) / (Ω × d²) = I / d²
The solid angle cancels, and what is left is the inverse square relation: illuminance falls with the square of the distance from a point source. Double the distance and illuminance drops to one quarter. Triple it and illuminance drops to one ninth. This follows from the definitions of intensity and illuminance plus the area of a spherical cap, so it needs no external formula source.
Apply it to the running example. A bar with a peak intensity of about 1188 cd somewhere in its beam produces an illuminance of about 1188 lx at 1 m on a perpendicular surface. Move the measurement to 10 m and the illuminance becomes 1188 divided by 100, which is about 11.9 lx. That is the entire explanation of why a bar that looks blinding at arm’s length looks modest at the end of a field.
The relation has a status beyond textbook arithmetic, and this is the part that surprises people. NIST describes the realization of the candela using a detector-based method that traces to the Primary Optical Watt Radiometer, and the working relation in that realization is the inverse square relation in its reverse form: measure the illuminance the source produces at a known distance and a known solid angle, then multiply by the distance squared and divide by the unit solid angle to obtain intensity. In other words, the candela is not realized by measuring candela directly; it is realized by measuring illuminance at a distance and converting.
That has a detail worth writing down carefully, because it is a common misreading. The solid angle factor in the NIST relation is the unit solid angle, equal to 1 sr, used to express intensity per unit solid angle. It is not the beam’s solid angle from the cone table. Mixing the two produces nonsense, typically an intensity figure that is either wildly too large or too small.
The current stated uncertainties on these realizations are small and worth knowing when you evaluate a claim of laboratory accuracy. NIST reports the candela at 0.2 % with a coverage factor k = 2 and the lumen at 0.50 % with k = 2. A vendor who cites a measurement to three or four significant figures against a specification with no stated uncertainty has not demonstrated anything, because the reference chain itself carries a stated uncertainty at the level of a fraction of a percent.
Two limits on the inverse square relation matter in the field. First, it assumes a point source. A 20-inch bar is an extended source, so the relation becomes accurate only at distances that are large compared with the bar’s aperture, and a bar measured at 1 m is not necessarily obeying it. Second, it assumes the receiving surface is perpendicular to the beam. Tilt the surface and the illuminance falls by the cosine of the tilt angle, because the same flux is spread over a larger area. Both limits are why field lux numbers taken at different distances and angles from different setups are not comparable without stating the geometry.
The practical result for a comparison between two bars is this: intensity in candela is a property of the fixture and its optic, while illuminance in lux is a property of the fixture, the distance, and the surface orientation together. A lux figure quoted without a distance is not a specification. A candela figure quoted without a beam angle is not, by itself, a beam description.
| You know | You want | Relation | What must be stated alongside |
|---|---|---|---|
| Peak intensity I and distance d | Illuminance E on a perpendicular surface | E = I / d² | Distance, and that the surface is perpendicular |
| Illuminance E at distance d | Peak intensity I | I = E × d² | Distance, and the unit solid angle convention |
| Flux Φ in a cone and the cone angle α | Average intensity in the cone | I = Φ / Ω with Ω = 2π(1 − cos(α/2)) | The full cone angle and the cone axis |
| Flux Φ inside a 60° cone | Solid angle and average intensity | Ω is about 0.8418 sr, so I is about Φ / 0.8418 | That the estimate is an average, not a peak |
LED packages already have optics inside them: the emitting structure above the chip
The LED is not a bare point that radiates evenly into space. Before any reflector cup or lens is bolted over it, the package itself has already shaped the emission.
HELLA’s description of a simple LED lists four parts. There is the LED chip. There is a reflector tray that contacts the cathode. There are gold bond wires contacting the anode. And there is a plastic lens that also serves to hold all the parts together and fix them in place. In the classical standard LED, the body is cylindrical and closes at the emitting end in a hemisphere. HELLA states that the emission angle of the LED is determined by the shape of this housing lens.
That last sentence deserves emphasis because it draws the line for this whole article. The package lens sets the emission angle of the device. It does not set the beam pattern of a finished light bar. Those are different problems, and HELLA’s page on simple LEDs does not describe how a light bar’s secondary reflector cup or TIR lens works. Nothing in this article should be read as transferring the package-level statement to the secondary optic.
There are also two different device classes with very different numbers attached, and the difference is relevant to how a light bar is built.
| Device class, per HELLA | Emitting area | Power and current | Light output |
|---|---|---|---|
| Simple 5 mm standard LED | 0.25 mm | under 0.1 W, 20 to 30 mA | about 1 to 2 lm |
| High-power LED, for example Luxeon Rebel | about 1 mm square | can operate up to 1000 mA under ideal conditions | about 40 to 100 lm |
HELLA notes that high-performance diodes use a large metal base to improve heat removal, which allows higher current, a larger emitting area, and higher light output, and that thermal resistance is reduced by a factor of ten relative to a simple 5 mm LED. Those are device-level explanatory figures published for workshop readers, so treat them as order-of-magnitude context rather than as test data. The thermal side of that picture is covered in depth in our article on LED light bar thermal management.
One further fact about the emitter itself constrains what an optic can do with it. The U.S. Department of Energy’s LED Basics page states that LEDs are not naturally white light sources: an LED emits near-monochromatic light, which makes it very efficient for colored-light applications, and white light for general illumination is produced by one of three routes, being phosphor conversion, mixing multiple monochromatic LEDs such as red, green and blue, or a hybrid combining phosphor conversion with monochromatic emitters.
The practical consequence is that a white LED emits its light from a phosphor layer and a die whose combined emitting area is not a mathematical point, and whose angular emission after the package lens is not uniform. A high-power emitter about 1 mm square with a hemispherical package lens is the input that a secondary optic has to work with. Every secondary optic is solving the same problem: take a source with physical size and a wide angular spread, and redistribute its flux into a cone you choose.
LED suppliers organize their catalogs around exactly that split between the emitter and the optics built over it. The manufacturer OSRAM’s exterior automotive lighting pages separate light sources and optical modules as distinct product lines for exterior applications, and Lumileds lists its high-power white automotive LED product line by power class, with bins below 3 W, below 6 W, below 8 W, and below 18 W. Both facts are useful only as evidence that the industry treats the emitter and the optic as two separate selections. Neither page supports any performance comparison, and neither is used for one here.
What “secondary optics” means and what both solutions may and may not claim
The term secondary optics refers to everything after the emitter. The package lens is primary optics, in the sense that it belongs to the device. A reflector cup or a TIR lens mounted over the emitter is secondary optics, and its job is not to make light but to move it.
This is where the honesty boundary of this article sits, and it is worth stating plainly before the two sections that follow.
What can be stated as fact: both a reflector cup and a TIR lens are direction-redistribution devices. Both act on the luminous flux that has already left the emitter. Both therefore change the luminous intensity distribution, and therefore change the useful luminous flux in any given cone, without changing the emitter’s total luminous flux.
What cannot be stated from the sources used here: the specific reflective surface form of a production reflector cup, whether it is parabolic or a compound parabolic concentrator or a freeform surface, its reflectance, the fraction of flux it sends into spill, and any efficiency comparison between a reflector cup and a TIR lens. Those numbers require either a manufacturer’s photometric file or an independent measurement of the finished fixture, and no such source was available for this article.
So the two sections that follow describe mechanism and geometry only. Where a quantitative statement would normally appear, this article says instead that the number must come from the manufacturer’s photometric data or from measurement. That is a deliberate limit, not an omission, and it is the same limit that applies to any comparison you read elsewhere that does not cite a test report per fixture.
How a reflector cup redistributes light: direction change by reflection
A reflector cup is a surface of revolution around the emitter axis, coated or polished so that it reflects the light that strikes it. The emitter sits near the vertex, and light leaving the emitter at large angles to the axis strikes the cup wall and leaves in a new direction determined by the local surface orientation.
Two geometric facts about the mechanism are worth holding onto, and neither requires a specific surface type.
First, the direction of a reflected ray depends on the angle between the incoming ray and the local surface normal. A surface region angled steeply relative to the emitter axis takes light that was leaving at a large angle and redirects it further forward. A surface region angled shallowly leaves the ray direction nearly unchanged. The distribution of surface angles from vertex to rim is therefore what determines the distribution of output directions, which is why the shape of the cup profile, and not just its depth or diameter, controls the pattern.
Second, the cup only acts on the light that strikes it. Light leaving the emitter inside the cone that misses the cup entirely, along with light that strikes the cup and is reflected back through the emitter plane, follows a different path. In a typical cup geometry the near-axis light passes over the cup rim directly, so a cup-based fixture has at least two output components: the directly transmitted near-axis component and the reflected wide-angle component. That is a structural reason why a reflector-based beam often shows a bright core with a surrounding region of lower intensity, and why the transition between the two regions can be visible as a ring or a step rather than a smooth gradient.
What the mechanism does not guarantee is a sharp outer boundary. The cup can only redirect light that reaches it. Any flux that leaves the emitter outside the cup’s capture envelope, either because the cup is too short or too narrow or because the geometry at the rim lets it past, continues on its original path. In a finished fixture that flux becomes the wide-angle spill, and its amount depends on the specific geometry. This article does not state a spill fraction for any cup, because none is available from the sources used here; the fraction must come from the manufacturer’s photometric file or from a distribution measurement on the assembled fixture.
The manufacturing side of a reflector cup is mechanical and therefore reachable by ordinary tolerancing. The surface needs a specific profile, a specific finish, and a specific alignment to the emitter. Each of those carries a tolerance, and the alignment tolerance between the cup axis and the emitter is the one that most directly moves the beam, because a tilted cup tilts the reflected component while leaving the directly transmitted component where it was. That is one physical route to a beam whose symmetry axis does not match the housing.
For a buyer, the useful reading is that a reflector-based product’s beam is the sum of at least two optical paths, and a specification sheet that reports a single flux total and a single beam angle is compressing that sum into two numbers. The compression is not dishonest, but it is lossy, and it is why two reflector-based bars with the same printed numbers can still look different on a wall.
How a TIR lens redistributes light: refraction, the critical angle, and total internal reflection
A TIR lens uses a different mechanism to do the same job. Instead of an open reflective surface, it is a solid body of optical material with an entry surface facing the emitter and a shaped exit surface facing forward, and it relies on the behavior of light at a boundary between two media of different refractive index.
The basic relations are standard geometric optics, and they are stated here as such: this is general physics rather than a conclusion drawn from a cited source in this article.
When light crosses from a medium of refractive index n₁ into a medium of refractive index n₂, the angle it makes with the surface normal changes according to Snell’s law, which states that n₁ sin θ₁ = n₂ sin θ₂, with the angles measured from the normal. Light entering a dense material from air therefore bends toward the normal. Light leaving the dense material for air bends away from the normal.
That second case is where total internal reflection comes from. When light travels from the denser medium toward the less dense one, the outgoing angle is larger than the incoming angle. At a particular incoming angle the outgoing angle reaches 90 degrees and the ray would have to travel along the boundary. That incoming angle is the critical angle θc, and it is given by:
- sin θc = n₂ / n₁
For light traveling inside a material of index n₁ toward air, n₂ is 1, so the critical angle depends only on the material’s index. An index around 1.5, typical of common optical plastics and glass, gives a critical angle near 42 degrees. An index around 1.59, typical of polycarbonate, gives a smaller critical angle, near 39 degrees. Those two figures follow directly from the relation and a published index value; they are not performance claims about any product.
Above the critical angle there is no transmitted ray at all. The boundary reflects the light back into the dense medium with essentially no loss through the interface, and that is the total internal reflection the lens is named for. The mechanism is not a coating and not a mirrored surface. It is the boundary itself.
A TIR collimator puts that behavior to work in two stages. The entry surface is normally a shallow dome or a recess directly over the emitter, and it refracts light as it enters the dense material, bending the near-axis rays toward the forward direction. The outer wall of the lens is shaped so that light arriving at large angles, which entered through the central entry surface, strikes that wall beyond the critical angle and is reflected forward by total internal reflection rather than escaping sideways. The exit surface, usually a shallow curved or flat face at the front, then applies a final refraction to the rays as they leave for air.
The result is a solid block that collects light over a wide range of input angles and delivers it forward through one front face. That is why a TIR lens physically resembles a small solid cylinder or dome with a bulge in front, rather than an open cup: the reflection happens inside the material, at its outer boundary.
Three properties of the mechanism follow from the geometry.
There is no exposed reflective coating to degrade on the reflecting surface, because the reflection is total and occurs at the material-air boundary. That statement concerns the TIR surface specifically; it says nothing about the entry surface, the exit surface, or the material’s behavior over time. This article makes no claim about aging, yellowing, haze, or transmission change in any lens material, because the standards that would be needed to support such a claim could not be retrieved when this article was prepared. Any comparison of polycarbonate and glass weathering must rest on independent aging and transmission data, not on this article.
The critical angle sets a hard boundary on the internal reflection. Rays arriving at the outer wall below the critical angle are partly transmitted through the wall and escape sideways instead of being redirected forward. A TIR optic’s capture envelope is therefore a geometric fact determined by its index and its wall profile, not a matter of tuning.
The entry and exit surfaces are refractive, so the beam is shaped by surfaces whose curvature and alignment carry their own tolerances. A lateral offset of the lens relative to the emitter moves the entry surface relative to the source, and a tilt of the lens tilts the output. As with the reflector cup, alignment between the optic and the emitter is one physical route to an optical beam axis that differs from the mechanical axis of the housing.
On the question that readers most often ask, this article takes an explicit position. Whether a TIR lens is more or less efficient than a reflector cup is not answered here. The sources used for this article do not establish that comparison, no photometric comparison of the two architectures was available, and no recovery percentage is quoted. Anyone who provides a number for that comparison should be able to show the two test reports it came from, per fixture, with the same measurement conditions.
What can be stated about the function is narrower and fully supported. The CIE vocabulary defines partial luminous flux inside a specified cone and useful luminous flux as the part of a source’s flux that contributes substantially to the task, and for a directional source it defines useful luminous flux as the partial luminous flux inside a cone about the optical beam axis. A TIR collimator is one known way to deliver a larger share of the emitter’s total flux into the chosen cone. That is a statement about the function the optic performs in the framework of the CIE definitions, not about the internal mechanism and not about its efficiency relative to another architecture.
Why the two mechanisms produce different beam edges, spill light and peak intensity
Both optics answer the same question, which is where to send the flux that the emitter produced. They differ in which portion of the emitted angular range they act on, and that difference is what shows up on the wall.
Think of the emitter’s output as a spread of directions from straight ahead to far off axis, as the package lens delivers it. A reflector cup intercepts the off-axis portion that strikes its wall and sends it forward, while the near-axis portion passes over the rim and continues on its own path. A TIR lens intercepts the near-axis portion through its central entry surface and the wide-angle portion through its outer wall, so it can act on both ends of the angular range inside one solid body.
That single structural difference produces four observable consequences.
Beam edge sharpness. A cup-based beam combines a directly transmitted core with a reflected surround, and the boundary between them depends on where the reflected component begins. If the reflected component is aimed to overlap the core, the combined edge can be soft, because it is the sum of a peaked and a plateau-like component. A TIR lens passes all its captured flux through one exit aperture, and the exit aperture’s projected outline as seen from a point in the beam sets a boundary that can be tighter. Neither statement is a guarantee about a particular product, because the exit or cup geometry decides the outcome in each case.
Spill light. Spill is flux that leaves the fixture outside the intended cone. Both mechanisms produce it. A cup produces it from flux that misses the cup, from flux that reaches the rim region at a grazing angle, and from surface finish scatter. A TIR lens produces it from rays arriving at the outer wall below the critical angle and therefore transmitted through it, and from scattering at the entry and exit surfaces and within the material. The relative amounts depend on the specific geometry, the surface finish, and the material, so this article states the mechanisms and not a fraction for either.
Peak intensity. Because peak intensity is the maximum of the intensity distribution, it rises whenever an optic concentrates more flux into a smaller solid angle. From the relation derived earlier, a fixed flux in a narrower cone must produce a higher average intensity, and therefore typically a higher peak as well. Which architecture reaches a higher peak for a given emitter is a property of each design, and it is measured, not inferred from the mechanism.
Core-to-surround contrast. A cup-based design with a directly transmitted core in the middle of a reflected wider component tends to show a hot center. A design that spreads its captured flux more evenly across the exit aperture tends to show a flatter plateau. The difference is perceivable on a wall and matters for the task: a strong core is useful for reaching distance, while a flatter plateau is useful for lighting an area near the vehicle.
One further consequence concerns the appearance of the fixture rather than the beam. A cup is an open cavity, so the emitter is partly visible from outside the beam. A TIR lens is a solid block over the emitter, and its front surface, entry dome and wall are all visible. Clear, diffused, tinted and textured versions of both exist, and lens color is a separate design choice from beam shaping. A tinted lens changes the spectral content of the light that passes it without changing the geometry of the beam; a textured or diffused front surface deliberately scatters light to soften edges at the cost of peak intensity. Neither property tells you whether the beam was shaped by a cup or by a TIR lens.
| Observable | Reflector cup mechanism | TIR lens mechanism |
|---|---|---|
| Path of the light | Reflects off an open surface to redirect it | Refracts at entry, reflects internally at the outer wall above the critical angle, refracts at exit |
| Near-axis flux | Commonly passes over the rim and continues | Captured by the central entry surface |
| Wide-angle flux | Captured by the cup wall | Captured by the outer wall above the critical angle |
| Failure to capture | Flux outside the capture envelope leaves on its original path as spill | Rays below the critical angle are transmitted through the wall as spill |
| Typical wall appearance | Bright core inside a wider reflected component | One aperture-defined region, edge sharpness set by the exit face |
| Consequence of an alignment error | Tilted cup moves the reflected component while the core stays put | Tilted lens moves the whole beam |
| Efficiency comparison | Not established by the sources used here | Not established by the sources used here |
The last row is not a placeholder. It is the honest state of the evidence, and any product page or forum post that fills it in with a percentage has a test report to show or it does not.
Beam pattern labels: what spot, flood and combo do and do not tell you
Product pages describe optics with a small vocabulary. A bar is labelled spot, flood, or combo, and sometimes driving, work, or scene. Those words describe intended beam shape, and they are useful, but they are not a measurement, and they do not identify the optical architecture that produced the shape.
A spot label says that the intensity distribution is concentrated into a comparatively narrow cone about the optical beam axis. A flood label says the distribution is spread over a wider solid angle with lower peak intensity. A combo label says the fixture contains more than one distribution, usually because different emitters or different optic elements in the same housing are aimed to produce both a concentrated component and a wide component, and the two overlap in the far field.
The words carry no numeric cone angle. Because the CIE definitions of partial and useful luminous flux require the full cone angle to be stated, a beam label without an angle is a qualitative descriptor only. Two bars labelled spot can be built with 10° and 25° cones respectively, and their peak intensities for the same total flux will differ by roughly the ratio of their solid angles. The label does not distinguish them.
The words also carry no information about which mechanism was used. A cup and a TIR lens can both produce a narrow beam, and both can produce a wide one. A lens that is clear, diffused, or tinted can sit in front of either mechanism, and the lens color visible through the front of a fixture is a spectral choice rather than a statement about the beam-shaping element behind it. This is why we do not infer an optical architecture from a product title anywhere in this article, and why it would be a mistake for a buyer to do so.
There is a further limitation worth naming. Beam labels are not standardized in the way the photometric quantities are. Spot, flood and combo are trade terms. The CIE vocabulary defines the quantities behind them precisely, but it does not define a cone angle that “spot” must mean. When two manufacturers use the same word for beams with different cone angles, neither is misusing a standard; the standard simply does not cover the word.
| Label as printed | What it claims about the distribution | What it does not state | What to look for instead |
|---|---|---|---|
| Spot | Flux concentrated into a comparatively narrow cone | The full cone angle, the peak intensity, the architecture | A stated cone angle and a peak intensity in candela, or an intensity distribution curve |
| Flood | Flux spread over a wider solid angle with lower peak intensity | The full cone angle, the peak intensity, the architecture | The same, plus whether the distribution is flat or peaked |
| Combo | More than one distribution combined in one housing | Which components, their angles, their relative flux shares | Per-component angles, or a distribution curve showing the two lobes |
For the task-matching side of this vocabulary, that is, which beam to choose for which job, the relevant article is our buying guide on spot vs. flood beam patterns. This article stays on the question of why the beams differ in the first place.
The triangle of peak intensity, beam angle and total flux, and why narrow means higher candela
Three numbers describe a directional light source, and they are linked, so a specification sheet that gives two of them constrains the third. The link is the relation derived earlier: average intensity over a cone equals the flux inside the cone divided by the cone’s solid angle, with the solid angle computed as 2π(1 − cos(α/2)).
Look at how the three move together when one is held fixed.
Hold the total flux constant and narrow the beam. The solid angle falls, so the average intensity rises. This is the case worked through earlier: 1000 lm in a 60° cone averages about 1188 cd, and the same 1000 lm in a 30° cone averages about 4671 cd. Peak intensity rises with it, because the peak cannot be below the average of a distribution that includes it.
Hold the beam angle constant and raise the total flux. Both average and peak intensity rise in proportion. Doubling the emitter count in a housing with the same optic and the same per-emitter collimation doubles the flux in the cone and therefore doubles the intensity, provided the emitters are collimated to the same axis and their outputs overlap in the far field.
Hold the peak intensity constant and widen the beam. The flux inside the cone must rise, which means a wider beam at the same peak requires more emitters or more flux per emitter. This is the case that explains why wide flood fixtures are physically larger or more numerous for a given target intensity.
The word “brightness” hides all three. In everyday use it means something like “how much light is coming out,” which is closest to flux, but when a driver compares two lamps side by side on a road, what the eye is responding to at distance is closer to illuminance on the road surface, which depends on intensity and distance. A lamp with lower total flux but a narrower, better-collimated beam can put more illuminance on a distant sign than a lamp with higher total flux and a wider beam. Neither product is lying. They are optimized against different variables in the same triangle.
There is one asymmetry in the triangle that buyers consistently miss. Beam angle and peak intensity are inseparable in a way that total flux and peak intensity are not. A manufacturer can double the emitter count and double the flux, and if the optic also widens, the peak may stay flat. A specification sheet that reports only the flux total has therefore told you nothing about the peak, and a sheet that reports only the peak has told you nothing about how much of the scene will be lit. Both are needed, and the beam angle is the number that connects them.
Why the beam can point somewhere other than the housing: optical axis against mechanical axis
The earlier section on the optical beam axis stated the CIE position: the axis about which the intensity distribution is symmetric is not necessarily the lamp axis through the cap, and not necessarily the axis perpendicular to the reference plane. In a mounted light bar, that distinction turns into a field symptom: the bar looks square and the light goes sideways.
Start with the mechanical side, which is the easy part. A housing has a bracket, a flange, or a bolt pattern. Those define a mechanical axis. Aligning the bracket to a reference surface, whether with a level, a template or a plumb line, aligns the mechanical axis. That operation says nothing about the optical beam axis, because the two are defined by different things: one by the metal, the other by the symmetry of the intensity distribution.
The optical side is where the offsets accumulate. The emitter is placed on a board with a placement tolerance. The optic is placed over the emitter with its own placement and tilt tolerance. The board is mounted in the housing with a tolerance, and the housing is welded or bolted to brackets with their own tolerances. Each step contributes a small angular error, and the total angular error is what separates the two axes. In a cup-based fixture, a tilted cup shifts the reflected component while leaving the directly transmitted core where it was, so the beam can appear to be a core with an off-center halo. In a lens-based fixture, a tilted optic shifts the whole beam, so the entire pattern moves.
Two consequences follow for anyone mounting a bar. The first is that a bubble level on the housing cannot verify aim, because it is a mechanical reference. The only verification that works is looking at the beam on a surface, which is the subject of the next section. The second is that a beam which is visibly off-center relative to its own housing is not automatically a defective unit; it may be an assembly tolerance that put the optical axis a degree or two away from the mechanical one. Whether that is acceptable depends on the application, and on how much aiming adjustment the bracket allows. If a bracket provides no angular adjustment on either axis, an assembly-level beam offset cannot be corrected at all, which is a design consideration rather than a manufacturing defect.
This is also why asymmetric beams complicate the concept. The CIE definition of the optical beam axis is stated in terms of a substantially symmetric intensity distribution. Automotive low beams are deliberately asymmetric, with a cut-off line and a rise on the kerb side, so a single symmetric axis does not describe them. The CIE vocabulary handles this by keeping the axis concept separate from the shape of the distribution rather than by stretching the definition to cover every asymmetric case.
A repeatable wall comparison for a reflector vs TIR lens beam
Comparing two beams by eye, at different times, in different places, with the camera auto-exposing each shot differently, produces conclusions that cannot be defended five minutes later. The same comparison run against a fixed reference produces numbers and shapes that can be re-checked. The difference between the two is procedure, and the procedure is not complicated.
The idea of a controlled wall check is not invented here. Automotive lighting practice evaluates headlamp patterns against a screen with defined reference lines, which is why the discussion of low-beam structure in the literature uses a vertical zero line, a cut-off line, and a rise angle measured from them. HELLA’s description of light distribution treats the symmetric component on the left of the vertical zero line as having to sit just below the dashed cut-off line to avoid glare, with the asymmetric component on the right improving visibility of the lane and the kerb, and notes that the rise of the asymmetric component depends on the light source and optical architecture: halogen rises continuously at roughly 15°, bi-xenon at roughly 12° over a 12° to 75° region, and LED low beam behaves similarly to bi-xenon but with a kink in the asymmetric structure that HELLA states is not a fault, and which exists to meet specific lux requirements in ECE regulation. Those are workshop-level figures from a parts manufacturer rather than a regulation text, and this article does not convert them into legal limits. What they demonstrate is the method: fix a reference geometry, then describe the pattern against it.
Adapt the method for an off-road bar or work light. Set the fixture on a stand at a measured height and a measured distance from a flat, light-colored wall. Mark a vertical line on the wall through the geometric center of the fixture, and a horizontal line at the height of the fixture’s optical center. Those two lines are the reference. Note the distance in meters, because the pattern’s size scales with it, and the heights, because they set the vertical reference.
Then photograph each beam from the same camera position with the same settings, and lock the exposure and white balance rather than letting the camera meter each shot. If the camera auto-exposes, a narrow high-peak beam will make the camera shorten the exposure and the surrounding spill will appear darker than it is, while a wide low-peak beam will do the opposite. Locking exposure removes that artifact, and it is the single most important step for comparing two beams honestly.
Read four things off each photograph against the reference lines.
- Where the brightest region sits relative to the vertical center line, which is the optical beam axis against the mechanical axis.
- The width of the bright region at the horizontal reference line, which is the beam’s horizontal spread in degrees once you convert from the wall distance.
- How abruptly intensity falls off at the edge, which distinguishes a beam that combines a core with a surround from one that does not.
- How much light lands far outside the bright region, which is the spill and, in a vehicle application, the part that reaches other road users.
To convert a wall measurement into an angle, use the geometry of the setup. If the bright region is w wide at a distance d, then the half angle from the axis is the arctangent of w divided by 2d, and the full angle is twice that. With the solid angle relation from earlier in this article, a measured full angle converts into a solid angle, and the solid angle converts an advertised flux into a minimum average intensity for a consistency check against any candela figure on the specification sheet.
Two limits apply to this method, and both need to be stated with the results. It cannot produce a calibrated intensity in candela, because a camera’s response is not a photometric measurement; for that you need a calibrated meter or a laboratory. And it produces a comparison valid only for the geometry used. A beam that looks narrow at 3 m may look like a broad wash at 20 m if the fixture has a wide low-intensity halo that only becomes visible at distance. Running the comparison at two distances, one close and one far, catches that case.
Record the fixture height, the distance, the camera settings, and the exposure lock method with the photographs. Without those, the images are illustrations rather than evidence, and they cannot be compared against a second session later.
| Step | What to fix | Why it matters |
|---|---|---|
| Mount | Fixture height and distance to the wall, both measured | Beam size and angular spread are derived from these two numbers |
| Reference lines | Vertical line through the fixture’s geometric center, horizontal line at its optical center | Gives a fixed frame for judging where the hot spot actually sits |
| Camera | Same position, same focal length, exposure and white balance locked | Auto-exposure makes a narrow beam look better and a wide beam look worse |
| Reading | Hot spot position, width at the horizontal line, edge abruptness, far-field spill | These four readings are what the beam comparison is actually about |
| Repeat | At a second, longer distance | A wide dim halo is only visible far from the fixture |
What a goniophotometer measures that an integrating sphere cannot
Two instruments dominate photometric measurement, and they answer two different questions. Confusing their outputs is one of the most common errors in reading a specification sheet.
An integrating sphere measures total luminous flux. The fixture is placed inside or at the aperture of a large sphere whose interior is coated with a diffuse highly reflective material, and the total flux leaving the fixture is derived from the illumination of the sphere’s inner surface. The output is a single number in lumen, plus derived values such as efficacy in lumen per watt when electrical power is measured as well.
A goniophotometer, also called a distribution photometer, measures luminous intensity as a function of direction. The fixture is rotated about one or two axes while a detector at a fixed distance records the intensity in each direction, and the result is a distribution: intensity in candela for each pair of angles. Flux is obtained afterwards by integrating the distribution over the solid angle, and cone-defined values such as partial luminous flux in a stated cone come directly out of the same data set.
NIST’s description of the realization of the lumen makes the split concrete. The lumen, the unit of total luminous flux, is derived from the candela by an absolute integrating sphere method, and NIST built its own sphere method in 1995. The same page records that most national metrology institutes use goniophotometers to calibrate luminous flux, and that the flux introduced into the sphere is determined from the illuminance at the aperture and the aperture area. So the two instrument families are not competing approaches to one number; they are two routes to related numbers, used by different institutes with different traceability chains.
The consequences for a buyer are sharp. A specification sheet that reports only total flux has given you a quantity that was measured without regard to direction. From that number alone, no intensity in any direction follows, and therefore no reach, no beam angle, and no peak. To make a directional claim you need either a distribution measurement or a stated intensity with a stated beam angle and a stated test condition. The CIE definitions support this directly: luminous intensity is the flux differentiated with respect to solid angle in a specified direction, so a distribution is what the quantity is defined in terms of.
There is a second, subtler consequence. Even a full intensity distribution does not by itself give you the useful luminous flux for your task, because useful luminous flux is defined with respect to a cone about the optical beam axis, and the cone has to be chosen. Two people with the same distribution curve can compute different useful flux figures by choosing different cones, and both are correct. This is why a specification should state the cone when it states a cone-defined figure, as in Φu,90°.
Two further CIE conventions exist precisely to make LED measurements comparable, and they show how much the geometry of a measurement matters. Averaged LED intensity is defined using a normalized geometry: a 100 mm² circular aperture perpendicular to the LED’s mechanical axis, at a distance of 100 mm from the LED tip under CIE standard condition A, or 316 mm under condition B, with the average illuminance over that aperture multiplied by the square of the distance and divided by the unit solid angle to give a value in candela. Partial LED flux for a single LED is defined by a 50 mm diameter circular aperture at a distance that together set the cone, centered on the LED’s mechanical axis, and the CIE entry notes that this quantity applies to a single LED and must not be confused with partial luminous flux. Both conventions exist because a bare LED has no defined beam, so the measurement geometry has to be fixed by agreement for results to be comparable. Both are described in detail in CIE 127, Measurement of LEDs.
The practical lesson transfers directly to light bars. When you compare two intensity figures, check that the measurement geometry is the same. Intensity measured at 1 m and at 10 m from an extended source can differ, because the far-field approximation has not converged at the closer distance for a 20-inch aperture.
An optics-only checklist for reading an LED light bar specification sheet
Most specification sheets for LED light bars are built around thermal, electrical and ingress data, with the optics reduced to a single flux total. This checklist is deliberately limited to optical items, so it does not repeat the electrical, thermal or sealing checks that other articles in this series cover.
Work down it and count how many of the four entries are actually present with testable definitions.
- Is a peak luminous intensity given in candela, with the test distance? Without a distance and a stated measurement geometry, an intensity figure is not reproducible. With them, it can be checked against the flux and beam angle claims.
- Is a beam angle given, and is it stated as a full cone angle? The CIE definition of partial luminous flux uses the full cone angle, so a half angle and a full angle differ by a factor of two and are not interchangeable. An angle without that clarification is ambiguous.
- Is the cone axis identified? Partial luminous flux must state the direction of the cone axis, which may be the mechanical axis, the optical beam axis, or another direction. For an asymmetric or offset beam this is the difference between a number that describes your situation and one that does not.
- Is a luminous intensity distribution curve or an IES photometric file available? A distribution removes the ambiguity instead of compressing it. If a file is offered, the beam can be evaluated for your own mounting height and distance rather than for the vendor’s stated test geometry.
Two further questions are worth asking, and they are about consistency rather than completeness. Does the stated beam angle match the stated peak intensity given the stated total flux, within the arithmetic of the previous sections? And if the sheet states a cone-defined flux, does it say which cone?
If a sheet answers none of those questions and prints only a large lumen number, the honest conclusion is not that the product is bad. It is that the sheet does not contain enough information to answer how far the light reaches, and that the number printed, however large, cannot be converted into an answer without additional data.
| Checklist item | Present and testable | Present but ambiguous | Absent |
|---|---|---|---|
| Peak intensity in candela | Value plus test distance plus geometry | Value with no distance or geometry | No intensity figure at all |
| Beam angle | Stated as a full cone angle | Stated without saying full or half | No angle given |
| Cone axis | Named, with the cone angle | Cone implied but axis unstated | Not mentioned |
| Intensity distribution | Curve or photometric file provided | Partial data, for example one cross-section | Only a total flux figure |
One test is available before the purchase, and it uses nothing but the sheet and a calculator. Take the advertised total flux in lumen, convert the advertised full beam angle into a solid angle with 2π(1 − cos(α/2)), and divide. The result is the average intensity that the fixture must exceed somewhere in the beam if both advertised numbers are true. Then look for a peak candela figure. If the sheet provides one and it is at or above that floor, the two numbers are mutually consistent at the level of arithmetic, which is not the same as being measured correctly but is a useful first filter. If the sheet provides no peak figure at all, the calculation has told you the minimum the optic must achieve and nothing about whether it does.
Where the arithmetic cannot help is exactly where a measurement is needed: the shape of the distribution inside the cone, the spill outside it, and the peak. Those require a goniophotometer, or at minimum a controlled wall comparison of the kind described earlier. No specification sheet shortcut replaces them.
The two Back Stage Series 20-inch bars on our own catalog illustrate the limit of what a page can tell you. The 20-inch combo beam light bar with clear lens is listed as a combo beam with a clear lens, and the 20-inch spot beam light bar with yellow lens is listed as a spot beam with a yellow lens. Same series, same 20-inch format, different printed beam label and different lens color. The titles do not state which secondary optic is inside either fixture, and this article does not infer one from a title. What the pair demonstrates is the practical point: beam label and lens color are the two optical attributes a product page usually gives you, and both leave the distribution unstated. Browsing the wider LED light bars category shows the same pattern across formats, with beam labels varying while the optics remain unspecified.
Common misreadings in the reflector vs TIR lens discussion
Five errors account for most of the confusion in this subject. Each one is a substitution of one quantity for another, and each can be checked against the definitions.
Reading lumen as candela. Lumen is flux, a total with no direction attached. Candela is flux per unit solid angle in a specified direction. A fixture with 1000 lm in a 30° cone has an average intensity of about 4671 cd across that cone; the same 1000 lm in a 120° cone averages about 318 cd. The flux figure is identical and the intensity figure differs by a factor of roughly fifteen. Any sentence that compares two fixtures’ brightness using only lumen figures is comparing totals, not brightness.
Reading lens material or lens color as beam shape. A clear lens, a diffused lens and an amber lens differ in how much light they transmit and in what spectrum, and a diffused surface deliberately scatters. None of that identifies the beam-shaping element. A TIR lens can be clear and a reflector cup can sit behind a diffused cover. The material and the tint are design choices about transmission and spectrum; the distribution is set by the geometry that redirects the rays.
Reading color temperature as brightness. Kelvin describes chromaticity, not intensity. HELLA’s explanatory table places warm white near 2700 K, a D2S gas discharge source near 4250 K and daylight near 5600 K, with higher color temperatures carrying more blue and less red. None of those figures says anything about candela, and two fixtures with identical optics but different color temperatures put the same intensity on a wall.
Reading total flux as reach. Reach is governed by intensity and distance through the inverse square relation. Doubling the flux doubles the intensity for a fixed beam, which increases reach, but so does narrowing the beam at constant flux. A 1000 lm fixture with a well-collimated 20° beam can out-throw a 2000 lm fixture that spreads its output over a 90° cone.
Reading a beam label as an optical specification. Spot, flood and combo are trade terms without a standardized cone angle, and none of them states peak intensity, distribution shape, or which mechanism produced the beam. They narrow the expectation and nothing more.
What this article does not establish, and when to get a measurement instead
Every article about optics runs the risk of sounding more certain than its evidence allows, so the limits are worth stating as clearly as the conclusions.
No efficiency comparison. This article does not state that a TIR lens is more efficient than a reflector cup, or the reverse, and it quotes no recovery or collection percentage for either. Sources sufficient to support such a comparison were not available, and a number of that kind has to come from two photometric tests of two finished fixtures measured under the same conditions. If a vendor quotes the comparison with no test report, treat the number as unsupported.
No lens material or weathering data. This article makes no claim about the light transmission, haze, yellowing or UV aging behavior of polycarbonate, glass, acrylic or any other lens material, and it does not compare them. That comparison requires aging and transmission test data against a recognized standard. We were not able to retrieve the relevant standard document when preparing this article, so the topic is left open rather than filled in from general impressions.
No optical architecture inferred from product titles. Where a product page says spot, flood or combo, that is what it says. This article does not conclude that a specific product uses a cup or a lens, because the product titles do not state it.
No lifetime or lumen maintenance figures. Output falling over time is a real effect and it interacts with optics, because an emitter whose output drops is still being collimated by the same optic. But this article defines no lifetime metric and quotes no hours. That ground is covered by our thermal management article, and this article only acknowledges the interaction and moves on.
No glare limits or regulatory thresholds. The CIE definition of glare is used here in its formal sense: glare is a visual condition caused by unsuitable luminance distribution or luminance range, or by extreme luminance contrasts, that produces discomfort or reduces the ability to see detail or objects. Disability glare is defined as glare that impairs the vision of objects and does not necessarily cause discomfort at the same time. Both definitions operate on luminance distribution and contrast, which is why glare is an optical distribution problem rather than a property of LED technology, wattage or lens material. This article stops at that definitional level and quotes no glare index limits, no threshold increment values and no regulatory figures, because the regulation text needed to support them could not be retrieved.
No standards clause numbers. Where the vehicle lighting literature is referenced, it is referenced as the source’s own description of workshop practice. No regulation clause, subsection or numeric limit is quoted here.
No measurement substitution. The arithmetic in this article produces consistency checks. It cannot convert a camera image into candela, cannot determine the shape of a distribution, and cannot measure spill. Where a decision depends on those, the answer is a goniophotometer measurement or a controlled wall comparison run at two distances, not a calculation.
When to involve a professional. Three situations call for it. If the fixture is going on a vehicle used on public roads, aiming and compliance questions belong with someone qualified to answer them, and the applicable rules are not covered here. If a purchasing decision depends on a specific intensity figure, request the photometric file or an independent test report rather than relying on a specification sheet. If two fixtures are being compared for a safety-critical application, the comparison should be made by measurement on the actual mounting geometry, because mounting height and distance change what the beam does.
Frequently asked questions
Does the reflector vs TIR lens choice change the total lumens of a light bar?
No. Both are secondary optics that redistribute luminous flux after it has left the emitter. Total luminous flux is a property of the emitter and its drive current, not of the element in front of it. What changes is the partial luminous flux inside any given cone, and therefore the luminous intensity in any given direction.
If two light bars both claim 1000 lm, can the one with the narrower beam throw further?
The narrower beam concentrates the same flux into a smaller solid angle, so its average and peak intensity must be higher, and by the inverse square relation a higher intensity produces more illuminance at any given distance. The arithmetic is a geometric necessity. Whether a specific product actually achieves it depends on whether the flux and beam angle claims are accurate, which is a measurement question.
Can I calculate a light bar’s beam distance from its lumen rating alone?
No. Lumen is a total with no direction attached. Distance depends on luminous intensity in a direction and on the illuminance threshold you care about, related by E = I / d². A lumen figure contains no information about intensity in any direction, so it cannot produce a distance without additional data such as beam angle or a distribution.
What is the difference between luminous flux and luminous intensity in one sentence?
Luminous flux, in lumen, is light energy per unit time weighted by the standard photometric observer and carries no direction; luminous intensity, in candela, is that flux differentiated with respect to solid angle in a specified direction.
Why does the CIE say the optical beam axis may not be the lamp axis?
Because the two are defined by different things. The optical beam axis is defined by the symmetry of the luminous intensity distribution, while the lamp axis is defined by the mechanical body, such as the axis through the cap or the axis perpendicular to the reference plane. Assembly tolerances and the optic’s own alignment can put them a degree or two apart.
Is a sharp beam edge always better than a soft one?
Not necessarily. A sharp edge concentrates flux and raises the average intensity inside the beam, which helps at distance. A soft edge spreads the transition, which can be preferable close to the vehicle where a hard boundary leaves an abrupt shadow line. The right choice depends on the distance to the task and on whether an abrupt boundary would be distracting.
Does the color of the lens change the beam pattern?
A tinted lens changes the spectral content of the transmitted light and, depending on how it is produced, may reduce transmission, but it does not by itself set the shape of the intensity distribution. The beam shape is set by the geometry that redirects the rays. A textured or diffused front surface does change the pattern by scattering, which is a separate design decision from tint.
Why do the numbers differ between an integrating sphere report and a goniophotometer report?
They measure different quantities. An integrating sphere produces total luminous flux in lumen with no directional resolution, while a goniophotometer produces luminous intensity in candela as a function of direction, from which flux is obtained by integration. NIST derives the lumen from the candela by an absolute integrating sphere method, and most national metrology institutes use goniophotometers to calibrate luminous flux, so both routes are in routine use for related but distinct quantities.
What does “useful luminous flux” mean for a directional light?
It is the part of a source’s luminous flux that contributes substantially to the lighting task. For a directional source, the CIE definition makes it the partial luminous flux inside a specified cone whose axis is the source’s optical beam axis. Because the cone has to be chosen, the cone angle must be stated with the value, as in Φu,90°.
Is flicker related to the beam pattern?
No. Flicker is defined in the time domain as a visual instability experienced by a static observer in a static environment, caused by fluctuation of the luminance or spectral distribution of a light stimulus over time, whether periodic or non-periodic, and it can originate in the source, the power supply or elsewhere. Beam geometry is a spatial property. The two are separate problems, and flicker diagnosis is covered in our troubleshooting material rather than here.
Editorial note
This article was written by the SAEC Lighting Engineering Team, Foshan. It is a technical explainer for the Lighting Basics category, and it is limited to what the cited public definitions and measurement documentation support: the CIE International Lighting Vocabulary, the NIST pages describing the realization of the candela and the lumen, U.S. Department of Energy solid-state lighting material, and HELLA Tech World’s technical pages for the automotive workshop.
Two topics were deliberately left open because the supporting documents could not be retrieved when this article was prepared. The efficiency of a TIR lens relative to a reflector cup is not stated, and no collection or recovery percentage is quoted for either. Lens material performance under weathering, including any transmission, haze or yellowing figures for polycarbonate against glass, is not stated either. Both topics need their own measurement and standards basis.
All diagrams in this article are original drawings made for SAEC, showing geometry and mechanism rather than any manufacturer’s product. Any numeric value in a diagram is either computed from a stated relation in the text or taken from the cited sources, and the article states which is which.
Last updated: 2026-10-14
Sources
- CIE e-ILV 17-21-111, useful luminous flux: https://cie.co.at/eilvterm/17-21-111
- CIE e-ILV 17-21-110, partial luminous flux: https://cie.co.at/eilvterm/17-21-110
- CIE e-ILV 17-27-076, optical beam axis: https://cie.co.at/eilvterm/17-27-076
- CIE e-ILV 17-21-045, luminous intensity: https://cie.co.at/eilvterm/17-21-045
- CIE e-ILV 17-21-060, illuminance: https://cie.co.at/eilvterm/17-21-060
- CIE e-ILV 17-21-039, luminous flux: https://cie.co.at/eilvterm/17-21-039
- CIE e-ILV 17-21-083, candela: https://cie.co.at/eilvterm/17-21-083
- CIE e-ILV 17-21-114, averaged LED intensity: https://cie.co.at/eilvterm/17-21-114
- CIE e-ILV 17-21-112, partial LED flux: https://cie.co.at/eilvterm/17-21-112
- CIE e-ILV 17-22-098, glare: https://cie.co.at/eilvterm/17-22-098
- CIE e-ILV 17-22-103, disability glare: https://cie.co.at/eilvterm/17-22-103
- CIE e-ILV 17-22-092, flicker: https://cie.co.at/eilvterm/17-22-092
- NIST, Photometry: https://www.nist.gov/programs-projects/photometry
- NIST, Realization of the candela: https://www.nist.gov/pml/sensor-science/optical-radiation/realization-candela
- NIST, Realization of the lumen: https://www.nist.gov/pml/sensor-science/optical-radiation/realization-lumen
- U.S. Department of Energy, LED Basics: https://www.energy.gov/cmei/ssl/led-basics
- U.S. Department of Energy, Color and Spectrum: https://www.energy.gov/cmei/ssl/color-and-spectrum
- U.S. Department of Energy, Research and Development, SSL Program: https://www.energy.gov/cmei/ssl/research-development
- U.S. Department of Energy, Solid-State Lighting: https://www.energy.gov/cmei/ssl/solid-state-lighting
- HELLA Tech World, Basic principles of car lighting technology: https://www.hella.com/techworld/us/technical/automotive-lighting/basic-principles-of-car-lighting-technology/
- HELLA Tech World, Light distribution: https://www.hella.com/techworld/us/technical/automotive-lighting/light-distribution/
- HELLA Tech World, LED headlights: https://www.hella.com/techworld/us/technical/automotive-lighting/led-headlights/
- ams OSRAM, Exterior Automotive Lighting Solutions: https://ams-osram.com/applications/automotive-mobility/exterior-lighting
- Lumileds, Automotive, Markets Served: https://lumileds.com/markets-served/automotive/
- Koito Manufacturing, Products and Technology: https://www.koito.co.jp/english/
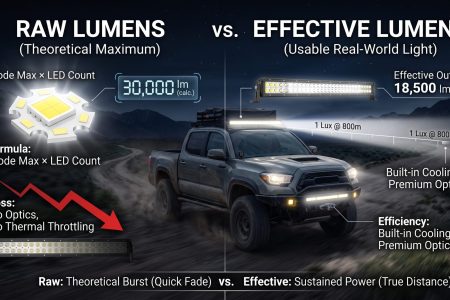
 by


