


On this page
A lamp’s “50,000 hour” figure is not an observation; it is a measurement of at least 6,000 hours at a controlled case temperature, fed into a curve fit, and multiplied by a cap of six. That sentence contains the whole subject of this article. LED lumen maintenance is the name for the ratio between a lamp’s initial light output and its output later in life, and the number you see on a specification sheet or a box is the result of a defined measurement standard, a defined projection standard, and a defined failure threshold being applied one after another.
This matters because the three steps are frequently compressed into one number and quoted as though it were a warranty. It is not. The measurement standard does not judge the result. The projection standard does not measure anything. The threshold is a convention chosen by whoever wrote the specification, and different specifications choose different thresholds for different reasons. Understanding the chain tells you which parts of a lifetime claim are evidence and which parts are arithmetic.
Quick answer
LED lumen maintenance is measured, not predicted from theory: a device is aged under controlled conditions and its light output is compared with its own starting output. The governing measurement standard is ANSI/IES LM-80-21, whose scope is LED packages, arrays and modules rather than finished lamps. It requires a maintenance test of at least 6,000 hours, with light output measured at intervals of no more than 1,000 hours, at a minimum of three discrete case temperatures: 55 °C, 85 °C, and a third temperature chosen by the manufacturer within plus or minus 2 °C.
The projection standard is ANSI/IES TM-21-21, which uses the LM-80 data to estimate how long the device will take to fall to a chosen percentage of its initial output. Its output notation is “Lxx Y hours”, where xx is the remaining percentage and Y is the projected number of hours. The threshold you will meet most often is L70: the point at which output has fallen to 70 percent of initial. L70 is a reporting convention, not a failure mode. An LED that has reached L70 still works.
Three limits govern how much a lifetime claim can carry. First, LM-80 does not include a pass or fail criterion and does not state how to predict lifetime. Second, TM-21 projections are capped in practice at six times the duration of the data they are based on, so a 6,000-hour test supports a projection of no more than 36,000 hours. Third, the standards force a distinction between the LED device and the complete lamp: LM-80 by itself is not a predictor of luminaire lumen maintenance, because a finished lamp also contains a driver, a printed circuit board, secondary optics, seals and a housing, each with its own aging behaviour.

What LED lumen maintenance actually measures
The quantity itself is a ratio, not an amount of light. It compares the luminous flux a device emits after a period of operation with the luminous flux the same device emitted at the start of the test, and expresses the result as a percentage. No absolute lumen figure appears in the definition, which is why two lamps with very different initial outputs can both be described as having 90 percent maintenance at 6,000 hours while delivering completely different amounts of usable light.
The ratio is meaningful only alongside the conditions under which it was produced. A maintenance figure without a case temperature, a drive current and a duration is an incomplete statement. The IES product description for TM-21-21 makes this explicit: flux maintenance depends on many variables, including operating temperature, drive current, and the technology and materials used to construct the product. It follows that maintenance varies not only between manufacturers but also between different LED package types from a single manufacturer.
The measured quantity is luminous flux, which is the photometric weighting of radiant power according to the sensitivity of the human eye. NIST’s photometric calibration service covers luminous intensity, illuminance, colour temperature, total luminous flux, luminous exposure and luminance, and issues calibrated standards of luminous intensity, luminance and colour temperature. Luminous flux is therefore a traceable quantity: a laboratory measuring maintenance is comparing a device with itself using instruments that trace back to a national standard, not inventing a scale.
Two conventions follow from the ratio being self-referential. First, the initial measurement is not optional and not approximate: LM-80-21 devotes a section to seasoning or aging before the maintenance test, because a freshly assembled LED can change output in its first hours of operation for reasons unrelated to long-term degradation. Second, all subsequent measurements are normalised to that initial value, which means an error or an inconsistency in the initial measurement propagates through every later percentage in the report.
The two curves every maintenance report contains
A white LED can lose flux and shift colour, and these two changes do not necessarily track each other. ANSI/IES LM-80-21 is titled Measuring Maintenance of Light Output Characteristics of Solid-State Light Sources, and its scope covers both: luminous, radiant or photon flux maintenance on the one hand, and colour maintenance on the other, including changes in chromaticity coordinates, peak wavelength or centroid wavelength over time.
Flux maintenance governs whether the lamp still puts enough light on the road or the work area. Colour maintenance governs whether the light is still the colour you specified. For a white lighting product, a chromaticity shift away from the design point can matter even when flux is holding up well, because the shift changes how the beam renders surfaces and how it appears next to other lamps on the same vehicle. The reason white light from an LED is a constructed rather than a native property is that LEDs emit nearly monochromatic light, and white is produced by phosphor conversion, by mixing multiple monochromatic emitters, or by a hybrid of the two, as the U.S. Department of Energy’s LED basics page explains. Anything that changes one of those conversion paths changes the colour.
The practical asymmetry is that flux maintenance has a mature projection method and colour maintenance does not. TM-21-21 exists to project long-term luminous, photon and radiant flux maintenance. A presentation given by Nichia engineers at Light Experience 2019 states that no good method yet exists to predict colour shift over the lifetime of an LED, that the Illuminating Engineering Society is developing one, and that like TM-21 it will not be perfect. Treat a flux-based lifetime claim as silent about colour, not as evidence that colour is stable.
A specification sheet that quotes only an L-number therefore tells you which of the two behaviours was measured and which was left unstated.
Why “50,000 hours” is not a measurement
The number 50,000 hours appears in lifetime discussions so often that it is easy to mistake it for a threshold defined somewhere. The IES product description for LM-80-21 does include the figure, but as a general statement about the technology rather than a claim about any product: LEDs typically exhibit very long operational life characteristics and, depending on drive current and use conditions, can be in use for 50,000 hours or longer.
Read the qualifier carefully. “Depending on drive current and use conditions” is doing the work. The same device, driven harder or run hotter, may not be in that category at all. The sentence is a statement about what the technology can do under favourable conditions. It is not a specification for a particular lamp, and it does not appear in ANSI/IES LM-80-21 as an acceptance criterion, because LM-80 does not have one.
The thresholds that do appear in published programme documents are different numbers, chosen for a different purpose. The ENERGY STAR manufacturer’s guide for qualifying solid-state lighting luminaires, in its April 2010 edition, uses 25,000 hours and 35,000 hours as the example application lifetimes for its own qualification programme. Those figures describe what that programme wanted to buy, not what LEDs in general deliver, and the programme belongs to general lighting rather than to vehicle lighting.
Where does that leave an automotive lifetime claim? In a specific and slightly uncomfortable place. The measurement and projection standards are the same standards, because they describe devices rather than applications. The threshold is the part that changes with application, and the application-specific threshold for vehicle lamps was not located during research for this article. A supplier citing an L70 figure for a work lamp or a light bar is therefore quoting a device-level projection, and the figure should be read as a projection rather than as a service guarantee.
L70, L90 and the shorthand that hides a threshold
An L-number is the answer to a question, and the question contains the threshold. L70 means the elapsed time at which flux maintenance reaches 70 percent of the initial value. L90 means the time at which it reaches 90 percent. L50 means half. Nichia’s presentation sets out the notation directly: the output of a TM-21 calculation is written as “Lxx Y hours”, where xx is the maintenance percentage, so 70 means 70 percent, and Y is the extrapolated value in thousands of hours, so 60 means 60,000 hours.
The threshold part of the label is not a statement about quality. A higher L-number is a stricter definition of end of life, which makes it a harder target to reach, which in turn makes the projected hours for the same device numerically smaller. L90 for a given device will always be a shorter time than L70 for that device, because output falls monotonically in the model and 90 percent is encountered before 70 percent. Quoting an L90 without the number is as incomplete as quoting a number without the L.
In vehicle lighting the useful question is not usually “when does this reach 70 percent” but “when does it fall below what my task needs”. A work light used for inspection or a light bar used to set up camp at night has a practical floor that has nothing to do with 70 percent. If the task needs, say, four fifths of the light it had when new, then L80 is the relevant threshold and an L70 rating describes a later and less demanding point. The label does not adapt to the task; the reader has to.
There is one more shorthand problem. L70 on its own, without a temperature, is under-specified in exactly the way described earlier. Two L70 values from two data sheets can only be compared if the underlying test conditions match, and the same device will produce different projected L70 figures at different case temperatures and drive currents. A comparison of L70 values across different conditions is not a comparison of products.
The mechanisms behind a falling light output
Flux declines because several distinct physical processes advance at once, and they do not share a rate. Once you separate them, the shape of a maintenance curve stops looking arbitrary.
The first is degradation at the semiconductor die itself, where the recombination efficiency of the light-emitting structure declines with cumulative operation and with temperature. The second is the phosphor conversion layer, which converts part of the short-wavelength emission into longer wavelengths; changes in that layer alter both how much light emerges and what colour it is. The third is everything in the optical path between the emitter and the outside world: encapsulant and lens materials that can discolour, and reflective surfaces inside the package or the housing that can lose reflectivity.
The Nichia presentation names the same categories and adds a practical observation: different package constructions age differently. It contrasts a heat-resistant polymer type with a flip-chip ceramic type, showing package discolouration and chip degradation plotted against time for each, and describes the moulding resin in that comparison as stable with minimal discolouration. The direction of the point is what matters: the package is part of the optical system, and a change to the package changes the maintenance curve, which is why TM-21-21 insists that maintenance can differ between package types from one manufacturer.
Drive current enters through the same route as temperature, with an extra step. More current produces more light and more heat in the same package, so the die and the phosphor both run hotter for a given cooling design. LM-80-21 accordingly treats the electrical conditions as part of the test definition, with separate clauses for DC constant current drive, pulse-width-modulated current drive, DC constant voltage drive and AC regulated voltage drive, plus a drive level value. If you need to know where a maintenance figure came from, the drive clause and level are part of the answer.
The other components that decide a lamp’s real life
A finished lamp is a system, and the LED is one part of it. The IES description of LM-80-21 states plainly that because a luminaire also contains power supplies and other components and operates in a variety of ambient environments, LM-80 by itself is not a predictor of luminaire lumen maintenance. The Nichia presentation turns that statement into a component list, and the list is worth reproducing because it is the most direct answer to “what else can fail first”.
Secondary optics can discolour and lose reflectivity, and heat and optical energy accelerate that process. The printed circuit board matters in two ways: solder joints can fail, which is catastrophic rather than gradual, and the board itself can discolour, with solder resist in particular becoming less reflective. The driver contains electrolytic capacitors, identified in the same presentation as one of the main factors in LED driver life because of electrolyte volatilisation, with a figure of roughly 40,000 hours at 85 °C given for even good-grade capacitors.
The conclusion the presentation draws is that while an LED does have its depreciation, it is not the weakest link, and that referencing an LED’s calculated lifetime as a fixture’s lifetime is a misstatement. That is a manufacturer’s engineering argument rather than an independent finding, and its numbers should be read as such, but the structural point stands on its own: the weakest-link component differs between designs.
For a vehicle lamp the exposure pattern sharpens this. A work light that runs continuously for hours at a time accumulates operating hours quickly, while a light bar used mainly on occasional night trips may take a decade to accumulate the same total. Either lamp can sit through repeated thermal cycling, and either can be exposed to condensation, washdown and chemical contact. A claim derived from 6,000 continuous hours of constant-current operation describes one part of that picture.


How LM-80 measures maintenance
LM-80 is a measurement method with a narrow and explicit scope: LED packages, arrays and modules. It does not cover finished luminaires, and it does not cover lamps that are sold as complete bolt-on products. When a lamp brand claims an LM-80-tested LED, the claim is about the light source component inside the lamp, not about the lamp as delivered.
The physical and environmental conditions are part of the method. LM-80-21’s contents include clauses for humidity, air temperature and air movement, and temperature measurement equipment or system, which exist because a maintenance test is fundamentally a controlled-temperature experiment. Air moving across the test fixture changes the temperature of the device, and an unshielded or badly placed thermocouple reads something other than the intended measurement point.
The measurement point is itself a defined concept. LM-80-21 defines the temperature measurement point, abbreviated TMP, and lists it among the terms the standard fixes. The test temperatures in the report are case or solder-point temperatures at manufacturer-designated locations, not junction temperatures. The junction is where the light is generated and where the temperature that actually drives degradation exists, and it is not directly measurable in a finished product. A maintenance figure attached to a case temperature is therefore one thermal step removed from the quantity that physically governs the result.
The third element of the method is timekeeping and the recording of failures, both of which have their own clauses. A maintenance test that runs for months needs elapsed-time recording that accrues only while the device is energised, and a test that runs for months will also produce devices that stop working. LM-80-21 devotes a clause to recording DUT failures because a failed device is not a data point at a low percentage; it is a different kind of outcome, and mixing the two corrupts the projection.
The six thousand hours and the three temperatures
The test conditions themselves are simple to state and easy to get wrong when quoted. The ENERGY STAR manufacturer’s guide states that, under IES LM-80-2008, LED packages, arrays and modules are tested for at least 6,000 hours at a minimum of three discrete case temperatures: 55 °C, 85 °C and a third temperature at the manufacturer’s discretion within plus or minus 2 °C, with light output measured at least every 1,000 hours and recorded for a minimum of 6,000 hours.
Three points and 6,000 hours is not an arbitrary shape. Three temperatures are enough to establish a trend in temperature so that a result for an intermediate operating condition can be interpolated rather than guessed, and 6,000 hours is long enough for the decline to be distinguishable from measurement noise while remaining an affordable test. The same guide notes that LM-80 sets 6,000 hours as a minimum but recommends 10,000, and that the September 2008 final version of LM-80 had changed the temperature set from the earlier drafts, which had required 45 °C, 65 °C and 85 °C.
The Nichia presentation adds the tolerance relationships that make the test temperatures meaningful. Testing must be conducted at a minimum of two different TS temperatures, being 55 °C or 85 °C plus a second point selected by the LED manufacturer. Ambient temperature, TA, must be within minus 5 °C of TS, and case temperature, TC, must be within minus 2 °C of TS, with testing continuing for at least 6,000 hours and measurements taken every 1,000 hours. Those tolerances are what stop a test from being labelled as an 85 °C test while the device actually sits at 78 °C.
The consequence for reading a report is that the temperature label is not decoration. A report describing 55 °C data tells you how the device behaved in a well-ventilated, relatively cool situation. A report at 85 °C or above tells you how it behaved in a hot one. If your installation resembles neither, the report is a boundary rather than an answer, and the useful question becomes whether the manufacturer can supply data at a temperature closer to your case.
Reading an LM-80 report without being misled
The first thing to check in an LM-80 report is what was tested and at what drive conditions. The report will identify a device under test, a drive level and a drive method, and will report case temperatures at named measurement points. If the drive current in the report is below the current your lamp runs its LEDs at, the wall-clock hours in the projection do not transfer directly, because drive current is one of the declared variables in flux maintenance.
The second thing to check is the duration and the interval pattern. A report that runs to 6,000 hours with measurements every 1,000 hours is the minimum shape. A report that runs to 10,000 hours or more carries more data and supports a stronger projection, both because the curve fit rests on more points and because the projection cap of six times the data length moves outward. A report with irregular intervals is weaker than its total hours suggest, because unevenly spaced samples give excessive statistical weight to certain points.
The third thing to check is whether the report describes a package or a lamp. LM-80 data describes a component. If a seller presents component-level maintenance data as the lifetime of a finished lamp, the missing step is everything in the component list above: driver, board, optics, seals and housing. The correct reading is that the light source inside the product has a documented maintenance behaviour, and that the product around it has not been characterised by that document.
The fourth thing to check is colour. LM-80-21 covers colour maintenance as well as flux maintenance, so a complete report has something to say about chromaticity, peak wavelength or centroid wavelength over time. A report that supplies only flux numbers has answered half of the question the standard can answer.
| What the report says | What it does not establish | Why it matters on a vehicle |
|---|---|---|
| Flux maintenance at a case temperature | Junction temperature in your installation | Case-to-junction difference depends on the lamp’s own thermal design |
| Maintenance at the reported drive current | Behaviour at a different drive current | Overdriving raises both output and degradation rate |
| Data for the LED package or module | Lifetime of the complete lamp | Driver, board, optics and seals age independently |
| A minimum 6,000-hour test | A measured 50,000-hour result | The longer figure is extrapolation, not observation |
Why LM-80 alone cannot answer a lifetime question
The division of labour between LED lumen maintenance measurement and lifetime projection matters because the two documents are often cited as if they were one. LM-80 is a measurement method, and the Nichia presentation states both halves of its scope directly: LM-80 does not state how to predict lifetime, and LM-80 does not have a pass or fail criterion.
That absence is deliberate. A measurement standard that fixed an acceptance threshold would be prescribing a performance level, which is the job of a specification or a regulation, so LM-80 leaves the threshold to whoever writes the specification. The consequence is that a lifetime claim has three separable parts: the measurement, meaning whether an LM-80 report exists, whether an accredited laboratory produced it and whether its conditions resemble the intended use; the projection, meaning which method was used over how much data and with what cap; and the threshold, meaning what percentage counts as end of life for the application and who decided. A claim that collapses all three into one number cannot be checked.
What TM-21 does with LM-80 data
TM-21 takes measured maintenance data and turns it into an estimate of how long the device will take to reach a chosen percentage. The IES product description for ANSI/IES TM-21-21 states that the document updates the recommended method of projecting flux maintenance from the data obtained by IES LM-80 testing, and that the update was carried out by a dedicated working group of LED industry professionals using LM-80 test data supplied by major LED manufacturers. A substantial part of that data came from tests extended to 9,000 hours and in some cases beyond.
The procedure is laid out in the standard’s contents, and the sequence is instructive. Section 5.0 covers flux maintenance life projection, with sub-clauses for normalisation, averaging, the data used for the curve fit, the curve fit itself, adjustment of results, the notation for the projected life, and a limit for projecting flux maintenance. The presence of a separate normalisation step and averaging step confirms that the input is a set of per-sample measurements that must be brought onto a common basis before anything is fitted.
Neither step improves weak data. Normalisation divides later measurements by the initial measurement for the same sample; averaging combines samples, because a projection from one device describes one device while a projection from a sample set describes a population. Both inherit the quality of what went in, so a weak initial measurement or an unrepresentative sample set survives them untouched.
The curve fit is where extrapolation begins, and it is where the input window matters. The Nichia presentation states that when LM-80 testing has gone beyond 6,000 hours, the most recent 5,000 hours must be used to calculate the maintenance value, so that the fitted curve follows the recent trend rather than averaging a long history that may span a change in mechanism. Whatever the precise window, the existence of a windowing rule tells you that the choice of data affects the answer.
The notation step, section 5.2.6, exists so that a projected life states both the threshold and the duration, which is the “Lxx Y hours” convention described earlier. Without it a projection can be quoted as a bare number of hours, which communicates nothing about what is being projected.
Then the standard goes beyond the basic fit. Section 6.0 covers temperature data interpolation, with 6.3 specifying that the Arrhenius equation is used to calculate the interpolated flux maintenance life. Section 7.0 covers current data interpolation, and section 8.0 combines the two by interpolating along current at a lower and a higher in-situ case temperature and then interpolating along temperature between those results. The practical reading is that TM-21 is designed to answer questions such as “what happens at 67 °C”, a temperature that was never tested.
Finally there are the safety rails. Section 5.2.7 is titled “Limit for Projecting Flux Maintenance” and section 9.0 is titled “Limits for Extrapolation”, with Annex D devoted to the limit for the duration of prediction and Annex E providing a data test set that validates the calculation against worked examples. Two separate clauses and a dedicated annex, all concerned with not projecting too far, are the standard telling you where it expects to be misused.
The six times rule and the regulatory form of the same limit
The projection cap is the single most useful piece of arithmetic in this subject. Industry certification programmes require a reported TM-21 value, and that value is restricted to six times the number of hours actually tested. The Nichia presentation states the reason in the same sentence: the limitations of the mathematical extrapolation and the lack of confidence in the data beyond six times.
Six times 6,000 hours is 36,000 hours, and six times 10,000 hours is 60,000 hours, so the rule converts a test duration into a ceiling on what may be claimed. That explains why manufacturers extend LM-80 testing: the extended data is not merely more reassuring, it is the only way to raise the ceiling. The same presentation warns against the obvious abuse of that logic, noting that the six-times rule cannot be applied to any length of test and that “just test longer and then multiply by six” is not a valid strategy.
There is a second cap in the same source: calculated TM-21 values are not to be used at all. The presentation states that the TM-21 addendum clearly says never to use calculated values, that this value is nevertheless too often used for false marketing claims, and that industry certifications require the reported value instead. The distinction is between an internal arithmetic output and a declared figure constrained by the reporting rules. The practical test for any lifetime figure is therefore arithmetical: ask how many hours were actually tested, multiply by six, and compare.
The clearest published example of an extrapolation limit comes not from a lighting programme but from a test procedure. On 9 July 2015 the U.S. Department of Energy published a supplemental notice of proposed rulemaking on test procedures for integrated light-emitting diode lamps, docket EERE-2011-BT-TP-0071, regulation identifier 1904-AC67, proposing procedures for lumen output, input power, lamp efficacy, correlated colour temperature, colour rendering index, power factor, lifetime and standby mode power, and incorporating two recently published industry standards describing lumen maintenance measurement and projection.
Its lifetime provisions are worth reading as a worked example. Where the test duration is less than 3,000 hours, no projection of lumen maintenance data is permitted, and the time-to-failure claim equals the test duration or the recorded time at which the lamp reached 70 percent maintenance, whichever is less. Where the duration is at least 3,000 hours but less than 6,000 hours, the direct extrapolation method may be used, but the maximum claim is computed by multiplying the test duration by a limiting multiplier that scales linearly, equalling one at 3,000 hours and six at 6,000. The document gives a worked case: a lamp tested for 4,500 hours may support a maximum claim of 15,750 hours, three and a half times the test duration. Where the duration is at least 6,000 hours, the projected time to failure is limited to no more than six times the test duration.
The document also explains why the cap matters at short durations. It states that the projection method it references does not provide a lumen maintenance projection method for a total elapsed operating time under 3,000 hours, because the spread of prediction estimates increases significantly for data sets that do not meet the minimum test duration requirements. A projection from too little data is not merely uncertain; its uncertainty grows fast enough to make the number meaningless.
Two further details show how much the data collection pattern matters. For durations of at least 6,000 hours, maintenance data used for direct extrapolation must be collected initially and at least once every 1,000 hours. For durations of at least 3,000 and less than 6,000 hours, data used for combined extrapolation must be collected initially, after 1,000 hours, and at least once every 500 hours thereafter. Data must fall within a plus or minus 48-hour window of each measurement point, must be equally dispersed in time to within the same window, and no two consecutive collection intervals after the initial 1,000 hours may differ by more than 96 hours in length, because uneven sampling gives excessive statistical weight to certain data points.

Temperature interpolation and the 67 degrees Celsius question
A lamp is never tested at the case temperature it will actually reach in service, which is why TM-21 includes interpolation methods rather than only a curve fit. Temperature data interpolation converts all temperatures to kelvins and uses the Arrhenius equation to calculate an interpolated flux maintenance life, according to the standard’s contents. The Arrhenius form is the standard way of describing a rate that accelerates exponentially with temperature, and its use here is a statement that flux decline behaves like a thermally activated process over the range where the model is applied.
Current data interpolation does the same job along the other axis, and section 8.0 combines them: interpolate along current at a lower and a higher in-situ case temperature, then interpolate along temperature between those two results. The reason to do the interpolation in that order rather than fitting a single surface is that the standard is designed to work with whatever data set is available while keeping each step interpretable.
The ENERGY STAR manufacturer’s guide shows the simpler linear version of the same idea in a worked illustration. It gives a linear interpolation equation in which the maintenance at the in-situ temperature measurement point of the hottest LED is calculated from a maintenance value below and a maintenance value above that temperature, weighted by the position of the in-situ temperature between the two case temperatures. In the guide’s example, an in-situ temperature measurement of 67 °C is bracketed by LM-80 data at 55 °C and 85 °C, and the interpolated result is 93.0 percent. That the same technique appears in a programme guide and in the standard’s later, more elaborate form is a reminder that the underlying problem is always the same: bridging the gap between tested conditions and real ones.
The trap in all interpolation is the same trap as in extrapolation. Interpolation between 55 °C and 85 °C is a bounded estimate. A value produced for an in-situ temperature above the highest tested case temperature is not interpolation at all, and the guide deals with that case explicitly, noting that a product cannot qualify through that route because there is no test data above the in-situ temperature. When a supplier quotes a lifetime for an installation that runs hotter than any tested condition, the arithmetic has to leave the data range, which is precisely where the confidence limits stop applying.
Why two devices with the same LM-80 report can age differently
The same device in two installations will not produce the same maintenance curve, even though it carries the same LM-80 report. The variables named in TM-21-21’s product description are operating temperature, drive current, and the technology and materials used to construct the product. Everything else is downstream of those three.
Operating temperature is set by the installation as much as by the lamp. The same work light bolted to an open flatbed and mounted behind a grille inside a sealed engine bay sees different case temperatures, and the difference persists over the whole life of the product. This is where thermal design and maintenance meet: the case temperature a thermal design produces is the input to the maintenance model. Readers who want the thermal side in full can work through the SAEC explanation of LED light bar thermal management, which covers the path from junction to air and the terms that are easy to confuse.
Drive current is set partly by the lamp’s driver and partly by the vehicle. A lamp whose driver pushes its LEDs hard to reach a headline output figure will run hotter and degrade faster than one that reaches a lower output figure more gently, even if the two lamps use the same LED part number. Because drive current is a declared condition in the maintenance test, the data applies only at the current it was measured at. The third variable is the device configuration: different package types from one manufacturer have different maintenance behaviour, so LM-80 data cannot be transferred between similar-looking parts without checking the report.
Derating, meaning running an LED below its maximum rated drive current, is a genuine engineering lever and is also frequently oversold. It is genuine because reducing current reduces the heat that must be removed through the thermal path. It is oversold because the maintenance model is not linear in current, and the projection standards handle current by interpolation between tested values, which makes interpolation trustworthy inside the tested range and progressively less so outside it.
There is a second problem specific to vehicle lighting: the enclosure. Sealed housings keep water and dust out and restrict the movement of air across surfaces that could otherwise carry heat away, so a design that runs comfortably on a bench at room temperature may run hotter in a sealed housing in still air at 40 degrees ambient. The honest version of a derating claim is therefore conditional: at drive current X, with this thermal path, in this enclosure, the light source has documented maintenance behaviour from an LM-80 report at a comparable case temperature. It does not say the lamp will last a specific number of years in any vehicle, because that requires knowing the case temperature the installation produces.
What colour maintenance adds to a flux figure
Flux maintenance answers “how much light is left”. Colour maintenance answers “is it still the same light”. On a white LED lamp the two answers diverge over time, and the divergence is not detectable from a distance.
The technical content of colour maintenance in LM-80-21 is chromaticity coordinates, peak wavelength and centroid wavelength, each tracked over time. Peak wavelength describes where the emission spectrum is strongest; centroid wavelength measures where the spectrum sits as a whole. A shift in either means the spectral power distribution has changed shape, not merely shrunk. For a phosphor-converted white LED, a change in the phosphor’s behaviour or in the encapsulant’s transmission can move the balance between the blue pump and the converted light, which changes the resulting colour.
In practice, a colour shift can announce itself long before a flux threshold is reached. Two lamps of the same nominal colour temperature mounted side by side stay matched as long as they age identically; if one runs hotter because of where it is mounted, or uses a different package construction, their chromaticity coordinates drift apart at different rates and the mismatch becomes visible. Nothing about either lamp’s light output percentage captures this.
The same logic applies to a single lamp used for colour-critical work. Colour rendition enters the picture as a separate characteristic tracked by DOE’s solid-state lighting programme alongside chromaticity and brightness perception, and a lamp whose spectral power distribution has shifted renders coloured surfaces differently. That matters for tasks where a person is judging material or condition rather than simply seeing in the dark.
The reason to treat colour separately is that the published projection machinery does not cover it. Flux projection has a standard, a cap and a reporting convention; colour projection has a developing method and no accepted cap. A lifetime claim backed by an LM-80 report may include measured colour maintenance over the tested hours, and it cannot honestly extend that colour behaviour to the projected hours. Where colour stability over time is a requirement, it has to be treated as an unprojected risk rather than a specified performance.
What the standards do not tell you about a lamp
A standard answers the question it was written to answer, and knowing which question that is prevents most misinterpretation.
LM-80 answers how this LED package, array or module’s output and colour changed, measured at these case temperatures and this drive condition, over at least 6,000 hours. It does not answer whether the device is good enough, because it has no pass or fail criterion. It does not answer how long the device will last, because it does not state how to predict lifetime. It does not answer anything about the lamp containing the device, because its scope is the component.
TM-21 answers what a defensible estimate is, given that data, of when the device reaches a chosen maintenance percentage within the limits the method sets. It does not answer whether that percentage is the right threshold for your application, because that is a specification decision. It does not make a projection from under 3,000 hours of data meaningful, it does not project colour, and it does not turn a device-level estimate into a system-level one.
The federal test procedure document supplies the third layer: it decides which threshold applies to a product category and constrains what may be claimed. The ENERGY STAR manufacturer’s guide supplies an example of the same decision made by a programme rather than a regulation, with 25,000 and 35,000 hour application lives and corresponding maintenance thresholds. Neither document governs vehicle lamps, and the automotive threshold was not identified during this research.
That gap is the honest state of the subject. The measurement and projection machinery is mature, standardised and traceable; the application-specific threshold for vehicle lighting is the part this article could not establish from a primary source, and any supplier asserting one should be asked to show where it comes from.
| Layer | Document type | Answers | Does not answer |
|---|---|---|---|
| Measurement | ANSI/IES LM-80-21 | Flux and colour maintenance of a package, array or module at set conditions | Whether the result is acceptable; how long the device lasts |
| Projection | ANSI/IES TM-21-21 | Defensible estimate of time to a chosen maintenance percentage, within caps | Which percentage is right; colour projection; system life |
| Threshold | Programme guide or test procedure | What maintenance level a category requires, and what may be claimed | Whether a vehicle lamp is covered |
| System life | No single standard located | Nothing directly | The combined ageing of driver, board, optics, seals and housing |
Lumen depreciation against sudden failure
Two outcomes are often merged in casual use: a lamp can lose output gradually and remain functional, or it can stop working. LM-80-21’s own description names the first: declining output without sudden and permanent failure creates a risk that a product near end of life may be operating but performing outside its specification, or outside required codes, standard practices or regulations.
That is the reason lumen maintenance is an engineering subject rather than a curiosity. A lamp that fails outright is obvious and gets replaced. A lamp that has fallen to 65 percent of its original output, still switches on and still looks bright at night is easy to leave in service long past the point where it does its job properly. The failure is silent, which is why a documented maintenance curve matters more for these products than for a lamp that simply dies, and why a projected figure can be read as a replacement-planning input rather than as a defect indicator.
The standards reflect the distinction. LM-80-21 has a clause on recording DUT failures, because a device that stops working is not a data point at low maintenance. The federal test procedure handles it explicitly: if lumen maintenance is measured at or below 0.7, or if a lamp fails resulting in complete loss of light output, time to failure has been reached and must not be projected using the projection procedures; instead it equals the last elapsed time measurement at which recorded output was at or above 70 percent of initial output. A cracked solder joint, which the Nichia component list places on the printed circuit board rather than in the LED, is the other kind of ending: immediate, and invisible on any flux maintenance curve.
Estimating real service hours from how a lamp is used
The hours in a lifetime claim are operating hours, not calendar time, and the gap between them depends entirely on duty cycle. A work light used for eight hours a night, five nights a week accumulates roughly 2,000 hours a year, while a light bar used on weekend trips might accumulate 100. The same 36,000-hour projection corresponds to roughly eighteen years in the first case and three and a half centuries in the second, which is a reminder that the projection stops being the limiting factor at low duty cycles.
What replaces it there is cycling and environment. A lamp switched on and off repeatedly experiences thermal cycling as its components heat and cool, and the Nichia presentation lists temperature cycling among the robustness tests that exist alongside LM-80, referencing JEITA ED-4701 and JESD22-A108 among others. Thermal expansion and contraction act on solder joints, seals and potting compounds, and none of that appears in an hours-based projection.
Temperature enters the estimate as well. A lamp that runs at a moderate case temperature for 2,000 hours a year may accumulate less degradation than one that runs hot for 500 hours a year, because the maintenance model is indexed to temperature as well as time. Comparing two candidate lamps by operating hours alone assumes their case temperatures are equal, which is rarely true. A defensible estimate therefore has three inputs rather than one: hours per year, the case temperature the installation produces, and the maintenance data at a comparable temperature. Where any of the three is missing, the estimate is a range at best.
Measuring condition, application condition and the gap between them
Every maintenance figure is produced under conditions, and every installation imposes conditions. Interpreting a lifetime claim is largely the work of comparing the two, and four comparisons matter.
The first is temperature. The report states case temperatures; the installation produces a case temperature between the lamp’s off state and its steady-state running temperature. If the installation runs hotter than any tested condition, the claim’s arithmetic has left the data range and the interpolation rules no longer apply. The second is drive current. The report states a current and the lamp’s driver sets a current; if they differ, the maintenance data describes a different operating point.
The third is mounting orientation and airflow. The operating orientation of a lamp during maintenance testing is specified in the relevant method, and ambient air movement is one of the controlled physical conditions in LM-80-21, so a lamp mounted tight against a surface in still air is not in the same thermal situation as one on an open bracket in moving air. The fourth is how the lamp is actually switched. Continuous operation is what LM-80 tests, and the Nichia presentation quotes a DOE research topics document observing that LM-80 measurements are taken with the LED packages operating continuously, that this does not necessarily reflect real-world operating conditions, and that there may not be a perfect match between predictions from laboratory results and practical experience.
The practical conclusion is not that laboratory data is worthless. It is that laboratory data defines a device’s behaviour under stated conditions, and the reader’s job is to establish whether their conditions are inside or outside those bounds.
What a supplier can give you, and how to read a listing
Most of the mechanisms described here are invisible in a product listing, and the way to make them visible is to ask for documents rather than numbers. The list below is a request list, not a claim that any particular supplier holds any particular document.
Ask for the LM-80 report rather than a summary of it. The report should identify the device under test, the drive method and drive level, the case temperatures with their measurement points, the test duration, the measurement intervals and the recorded failures. Ask for the data at the case temperature closest to your installation rather than the temperature that produces the most flattering projection, and ask how many hours were actually tested so that you can do the multiplication yourself. Ask whether the figure being quoted is the reported value or the calculated value, because the two are not interchangeable and one of them is not meant to be quoted at all.
Ask what was tested as well. If the report covers an LED package while the claim covers a finished lamp, ask what evidence exists for the rest of the system: the driver and its capacitors, the printed circuit board and its solder joints, the secondary optics, and the seals. Ask whether colour maintenance data exists for the same device. For a light bar or a work light the answer is often that component data exists and system data does not, which is worth knowing before ordering. The SAEC catalogue of LED light bars and LED work lights lists the product families such questions would apply to.
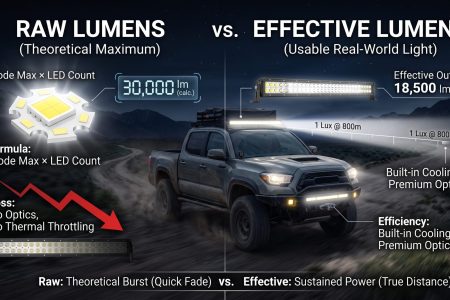
In a listing itself, three checks surface most of what matters. The first is whether the lifetime figure has a threshold attached: “50,000 hours” without an L-number does not say what is being measured, “L70 50,000 hours” says the projection is to 70 percent maintenance, and “L90 50,000 hours” is a considerably stronger statement about the same device because the 90 percent point arrives earlier in the model. The second is whether the figure is attached to the light source or the lamp, because the distinction between device and system is the single most common source of overstatement in this subject. The third is whether the output figure and the lifetime figure were produced under the same conditions, since a lamp marketed on a high output figure may have reached it by driving the LEDs harder, which raises the operating temperature and shortens the time to the maintenance threshold. Both numbers can be accurate and still describe a lamp that fades faster than a lower-output competitor. A related convention question applies to claims measured in raw rather than usable output, and the SAEC explanation of raw versus effective lumens sets out how those two figures relate.
A fourth check applies where a lifetime figure sits next to a warranty. A warranty is a commercial undertaking with terms, not a life-test result, and the two need not be the same length. Where the warranty is shorter than the projected lifetime, the projected lifetime is an engineering estimate and the warranty is what the seller will stand behind.
Comparing a lamp against its own past
You cannot run an LM-80 test in a driveway, and you can still observe whether a lamp has lost output relative to its own past. The methods below are comparisons rather than measurements, and their purpose is to make a change visible rather than to put a number on it.
Keep a reference lamp. Comparing an aged lamp against a new one of the same model and colour temperature, side by side against the same surface in the same conditions, makes a difference visible that a single lamp cannot show. The comparison has to control the obvious variables: same distance, same surface, same ambient darkness, same supply voltage.
Photograph the beam on a fixed surface from a fixed position with fixed camera settings, and repeat periodically. The camera is not a photometer, and the method’s value comes from consistency rather than accuracy: the same camera with the same exposure at the same distance will show a relative change even though it cannot report absolute lux. Record the date, the battery or charging state and the ambient conditions with each photograph, because a photograph taken on a low battery is not comparable with one taken on a full charge. Record operating hours rather than calendar time in the same log, since hours are what a projection is expressed in.
Look for the changes that are not flux. A lens that has yellowed, a reflector that has lost its finish, a connector showing heat discolouration, or two lamps on the same circuit that no longer match in colour all bear on the same subject. Readers dealing with a lamp that flickers rather than fades are looking at a different problem, and the SAEC guide to diagnosing light bar flicker covers that case.
Why LED lumen maintenance data cannot answer every question
The limits of the subject are as important as its content. Maintenance describes the ratio of output to initial output, so it says nothing about whether the initial output was sufficient: a lamp with excellent maintenance and insufficient peak intensity is still an inadequate lamp, and the two properties are measured by different methods. It says nothing about whether a beam pattern is suitable, because beam distribution is an optical property that a flux ratio does not capture. It says nothing about whether a lamp is road legal, because legality follows approval markings and vehicle-level rules rather than maintenance.
It also says nothing about the condition of the rest of the system. A driver with ageing capacitors, a board with discoloured solder resist and a lens that has yellowed all reduce the light you see without appearing in a device-level maintenance figure, and catastrophic outcomes such as a cracked solder joint or a failed seal are outside its scope entirely. Nor does it describe behaviour outside the tested conditions: interpolation within the tested range is a defined method, while a value produced beyond the tested range sits outside the method’s assumptions. Colour behaviour beyond the tested hours is likewise unprojected, because the projection method covers flux and the colour projection method is still being developed.
Frequently asked questions
What percentage of its original output does an LED have at L70?
By definition, 70 percent. L70 names the moment at which measured luminous flux has fallen to 70 percent of the initial value, so the label and the percentage are the same statement. The number of hours attached to an L70 figure is a projection of when that point is reached, not a measurement of it.
Does an LED stop working at L70?
No. L70 is a reporting threshold, not a failure mode. The IES description of LM-80-21 explains the underlying problem directly: LEDs decline in output without sudden and permanent failure, so a product near end of life may still be operating while performing outside its specification or outside required codes, standard practices or regulations. A lamp at 70 percent maintenance still lights; it simply produces less than it did.
Is 50,000 hours a standard LED lifetime?
No single lifetime figure is written into the measurement standard as a requirement. The IES product description for LM-80-21 states that LEDs can be in use for 50,000 hours or longer depending on drive current and use conditions, which is a general statement about the technology with an explicit dependency. LM-80 itself has no pass or fail criterion, so no hours figure functions as a pass mark.
How many hours can be claimed from a 6,000-hour test?
Six times the tested duration, which is 36,000 hours. Reported TM-21 values are restricted to six times the hours actually tested, and a U.S. Department of Energy test procedure document applies the same ceiling for test durations of at least 6,000 hours while scaling the multiplier linearly from one at 3,000 hours. A claim beyond that ceiling is not supported by the projection method it cites.
Can two lamps with the same LED have different lifetimes?
Yes, and the difference can be large. TM-21-21’s own description states that flux maintenance depends on operating temperature, drive current, and the technology and materials used, and that maintenance can differ between package types from a single manufacturer. Even with identical LEDs, a lamp with better thermal design, a lower drive current, or a less restricted enclosure will run cooler and reach a given maintenance threshold later.
Does an LM-80 report tell me how long my lamp will last?
It does not. LM-80’s scope is LED packages, arrays and modules, and the IES description notes that because a luminaire also contains power supplies and other components and operates in a range of ambient environments, LM-80 by itself is not a predictor of luminaire lumen maintenance. The report describes the light source inside the product under test conditions.
What is the difference between the calculated and reported TM-21 value?
The calculated value is an internal output of the projection arithmetic. A presentation by manufacturer engineers at a 2019 industry event states that the TM-21 addendum says never to use calculated values, and that certification programmes require the reported value, which is capped at six times the tested hours.
Can I estimate the operating hours my lamp will see?
Working hours per week give an annual figure quickly, and that figure is directly comparable with a projection expressed in hours. What it does not capture is the case temperature your installation produces, which is the other input the projection depends on.
Does a higher drive current always shorten lamp life?
It moves the operating point in that direction rather than guaranteeing a specific outcome. Drive current is one of the declared variables in flux maintenance, and higher current raises the heat that must be removed. Because the projection standards handle current by interpolation between tested values, a claim about a current outside the tested range is an extrapolation rather than an interpolation.
Why do two lamps on the same vehicle fade differently?
Usually because they are not in the same thermal situation, even when they are the same model. Airflow, mounting orientation, the surfaces immediately around the housing and the drive current the lamp actually runs at all differ between positions, and case temperature follows those differences. The lamp in the worst position reaches any maintenance threshold first.
Is there a limit to how long a lifetime projection can be?
Yes, and there are two caps rather than one. The projection standard includes limits for extrapolation, and reporting conventions restrict a reported value to six times the hours tested. A separate regulatory test procedure scales the maximum claim linearly from one times the test duration at 3,000 hours to six times at 6,000 hours, and forbids projection entirely below 3,000 hours.
Does lumen maintenance data cover colour stability?
Not automatically, and not beyond the tested hours. ANSI/IES LM-80-21 covers colour maintenance as well as flux maintenance, including changes in chromaticity coordinates, peak wavelength and centroid wavelength over time, so a complete report has measured colour data over the test. Projecting that colour behaviour forward is a different matter: a 2019 manufacturer presentation states that no good method for predicting colour shift over lifetime yet exists.
Editorial note
This article explains the measurement and projection machinery behind LED lifetime figures. It does not report lifetime data for any SAEC product, and no product-specific LM-80 report or L70 declaration was available during research, so no such figure appears here. Where a claim is a manufacturer’s engineering argument rather than an independent finding, the text says so. The ENERGY STAR figures quoted are from a general-lighting programme document and are used as a worked example of how a threshold maps to a lifetime claim; they are not vehicle-lighting requirements, and no vehicle-lighting maintenance threshold was identified from a primary source. Standards are revised; check the edition in force before relying on a specific clause.
SAEC Lighting Engineering Team, Foshan
Last updated: 2026-10-15
Sources
- Illuminating Engineering Society. ANSI/IES LM-80-21, Approved Method: Measuring Maintenance of Light Output Characteristics of Solid-State Light Sources. IES Webstore product page (scope, contents, product description). https://store.ies.org/product/lm-80-21-measuring-maintenance-of-light-output-characteristics-of-solid-state-light-sources/
- Illuminating Engineering Society. ANSI/IES TM-21-21, Technical Memorandum: Projecting Long-Term Luminous, Photon, and Radiant Flux Maintenance of LED Light Sources. IES Webstore product page (scope, contents, product description). https://store.ies.org/product/tm-21-21-projecting-long-term-luminous-photon-and-radiant-flux-maintenance-of-led-light-sources/
- U.S. Environmental Protection Agency and U.S. Department of Energy. ENERGY STAR Manufacturer’s Guide for Qualifying Solid-State Lighting Luminaires, April 2010. https://www.energystar.gov/ia/partners/manuf_res/downloads/ENERGYSTAR_Manufacturers_Guide_v2.1.pdf
- Nichia Europe B.V. / Nichia Chemical Europe GmbH. False Lifetime Claims & Expectations Are a Real Issue, Light Experience 2019, Bucharest (Menno Schakel, Erik Swenson). https://www.electricianul.ro/wp-content/uploads/2019/12/LightExperience-2019-Nichia-LED-Lifetime-Claims-1-low.pdf
- U.S. Department of Energy, Office of Energy Efficiency and Renewable Energy. Energy Conservation Program: Test Procedures for Integrated Light-Emitting Diode Lamps, supplemental notice of proposed rulemaking, 9 July 2015, Docket No. EERE-2011-BT-TP-0071, RIN 1904-AC67. https://www.federalregister.gov/documents/full_text/xml/2015/07/09/2015-16477.xml
- U.S. Department of Energy. LED Basics, Solid-State Lighting programme. https://www.energy.gov/cmei/ssl/led-basics
- U.S. Department of Energy. Color and Spectrum, Solid-State Lighting programme. https://www.energy.gov/cmei/ssl/color-and-spectrum
- Miller, C. C., Nadal, M. E., Tsai, B. K., and Zong, Y. NIST Measurement Services: Photometric Calibrations, NIST Special Publication 250-95, 2018. https://www.nist.gov/publications/nist-measurement-services-photometric-calibrations
 by


